SES & Achievement Explorer
Explore how student outcomes relate to community context.
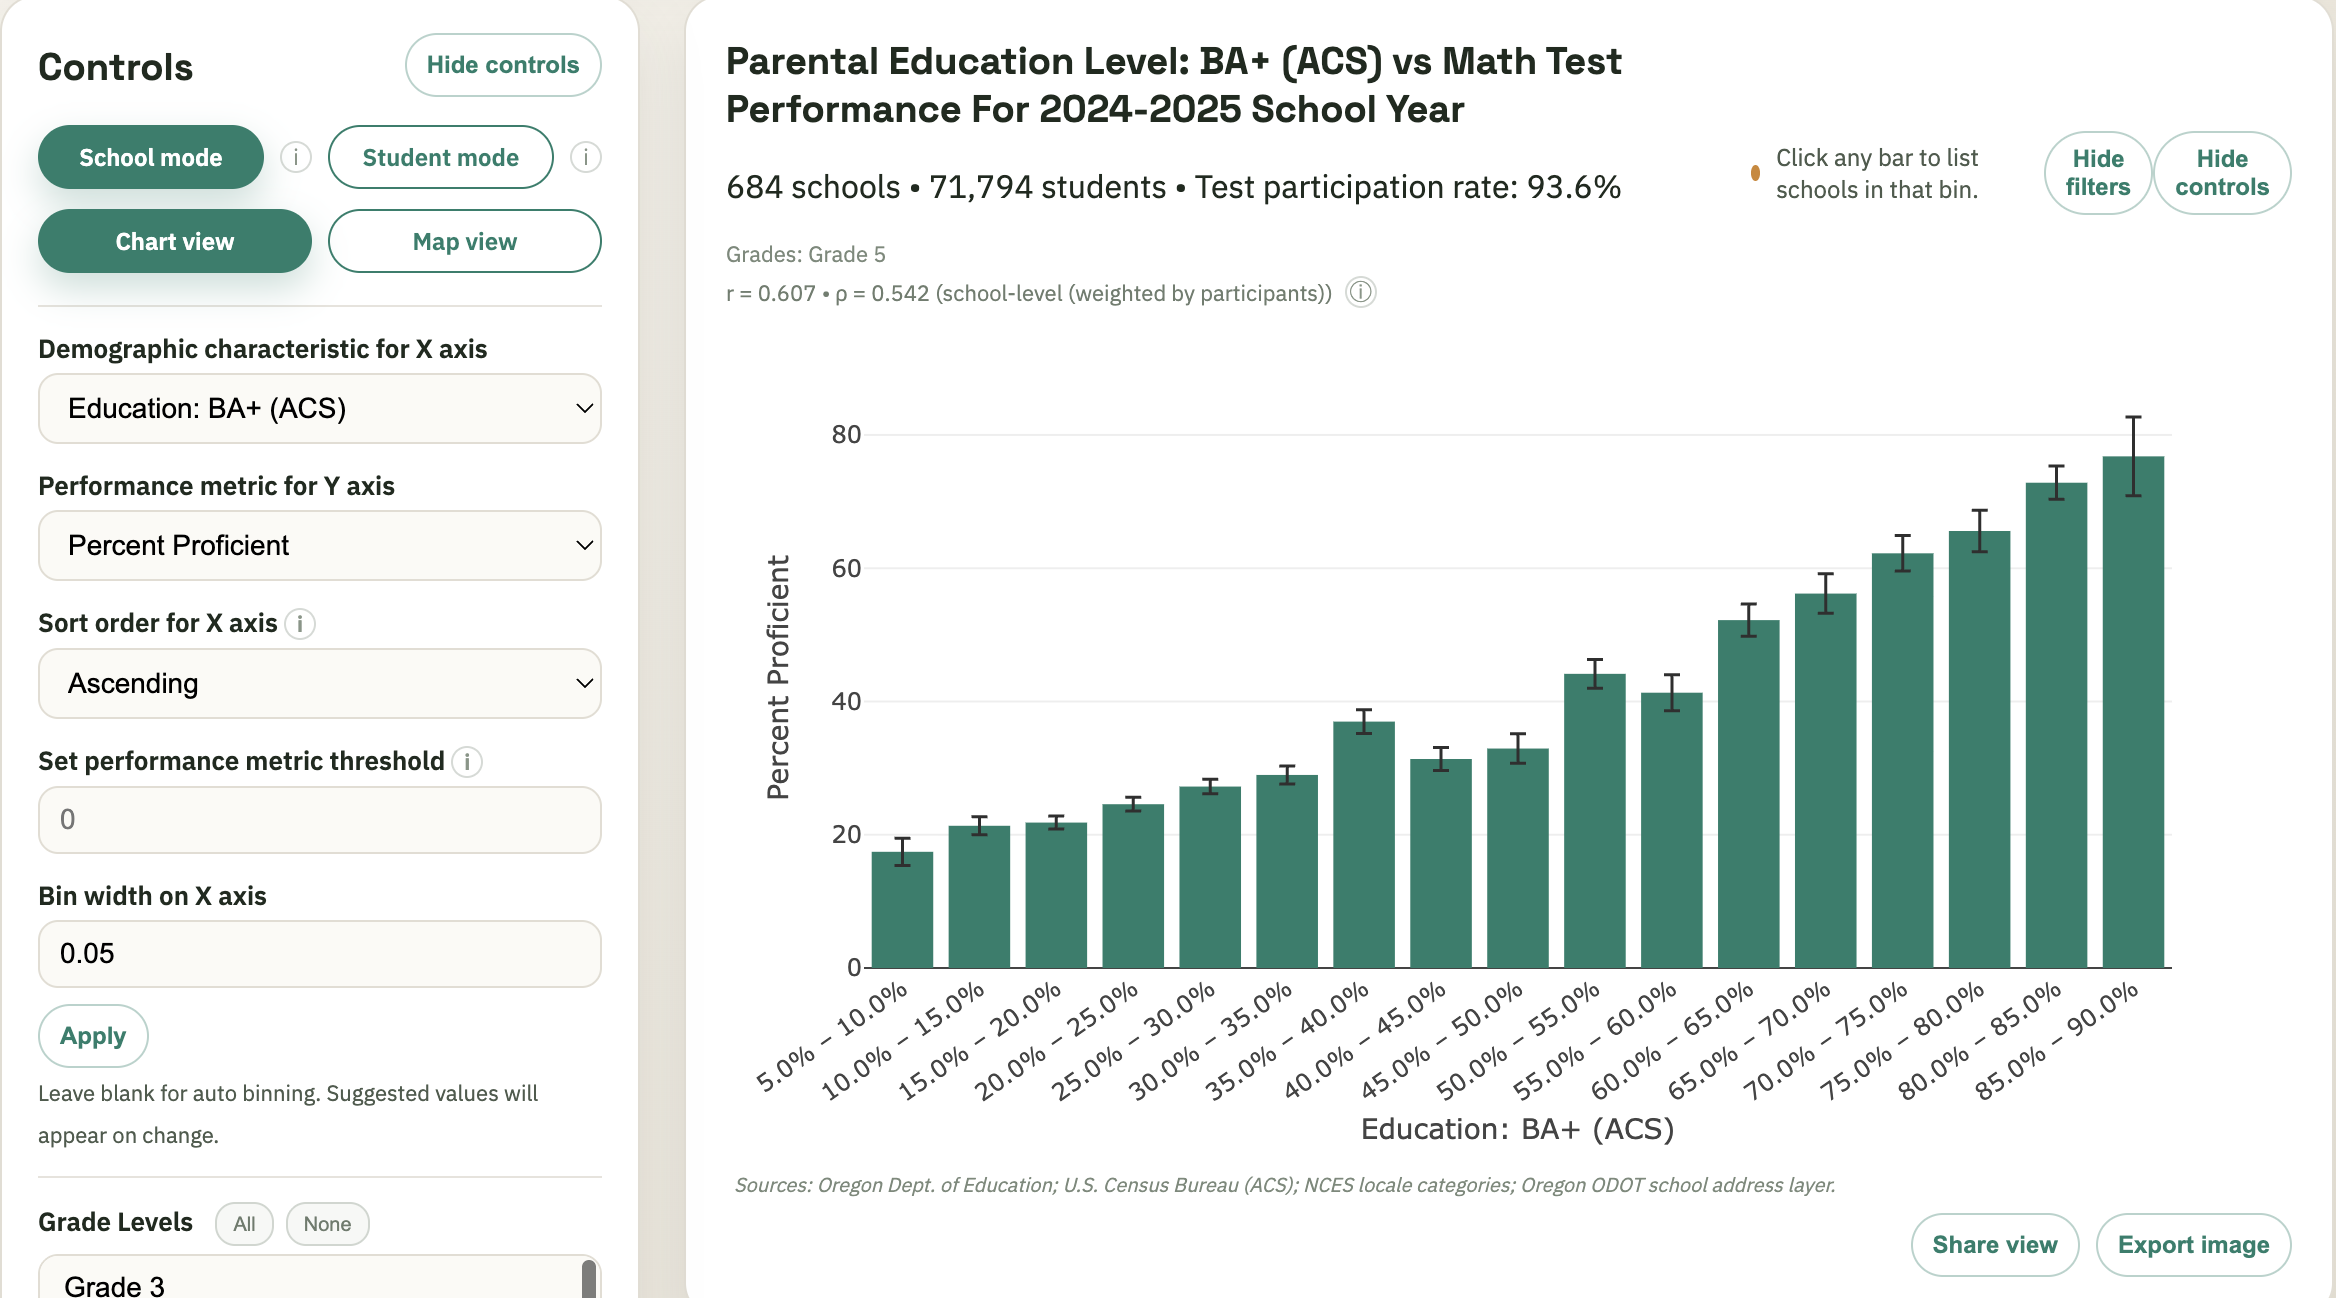
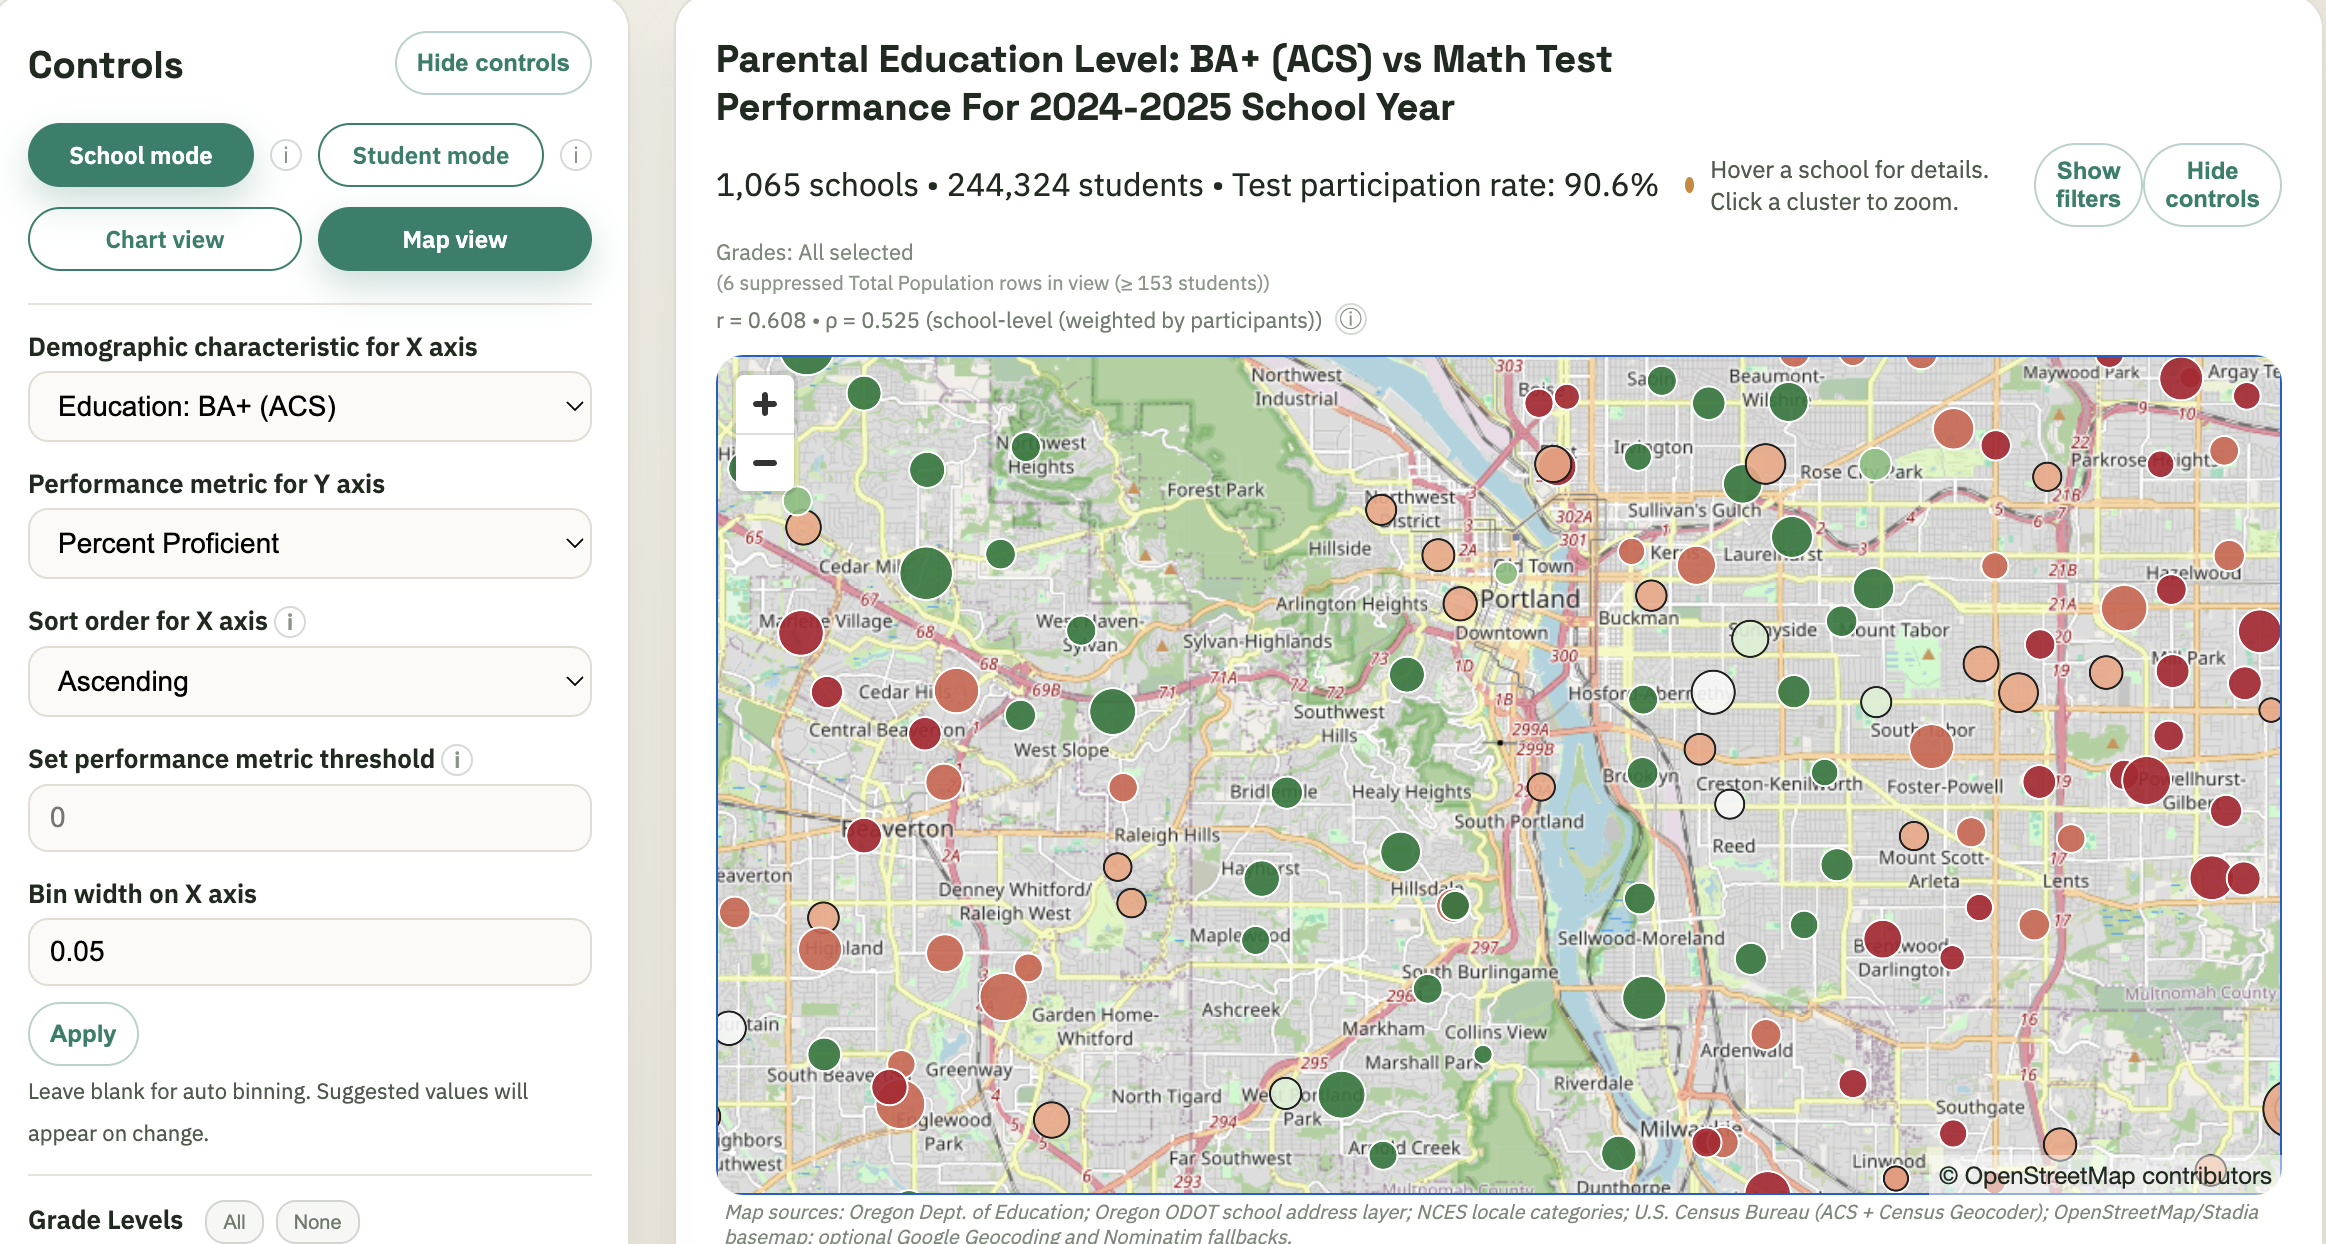
The dashboard on this site combines Oregon achievement test data with socioeconomic information such as neighborhood income and adult education levels. Use it to create graphs and maps that show community conditions that may affect student success in school and in later life.
The highlights section provides examples of the visualizations you can create with the dashboard. They focus on attendance, income, education, funding, class size, and geography. Each highlight includes a direct link to the corresponding live dashboard view.
Where the data comes from
Oregon Department of Education assessment results, U.S. Census Bureau (ACS) socioeconomic data, NCES locale categories, and ODOT school address layers.
Why it matters
The statewide view surfaces persistent patterns across the full income and education spectrum, not just at the extremes.