Two-factor model using 2024-25 data. Analysis updated: 2026-07-09.
Oregon schools in communities with more college-educated adults tend to have higher test proficiency.
But schools also differ in the share of enrolled students experiencing poverty. This check asks whether
adult BA+ is merely a stand-in for student poverty, or whether both measures carry distinct information.
School poverty explains a large share of school-to-school proficiency differences, especially in ELA and Science.
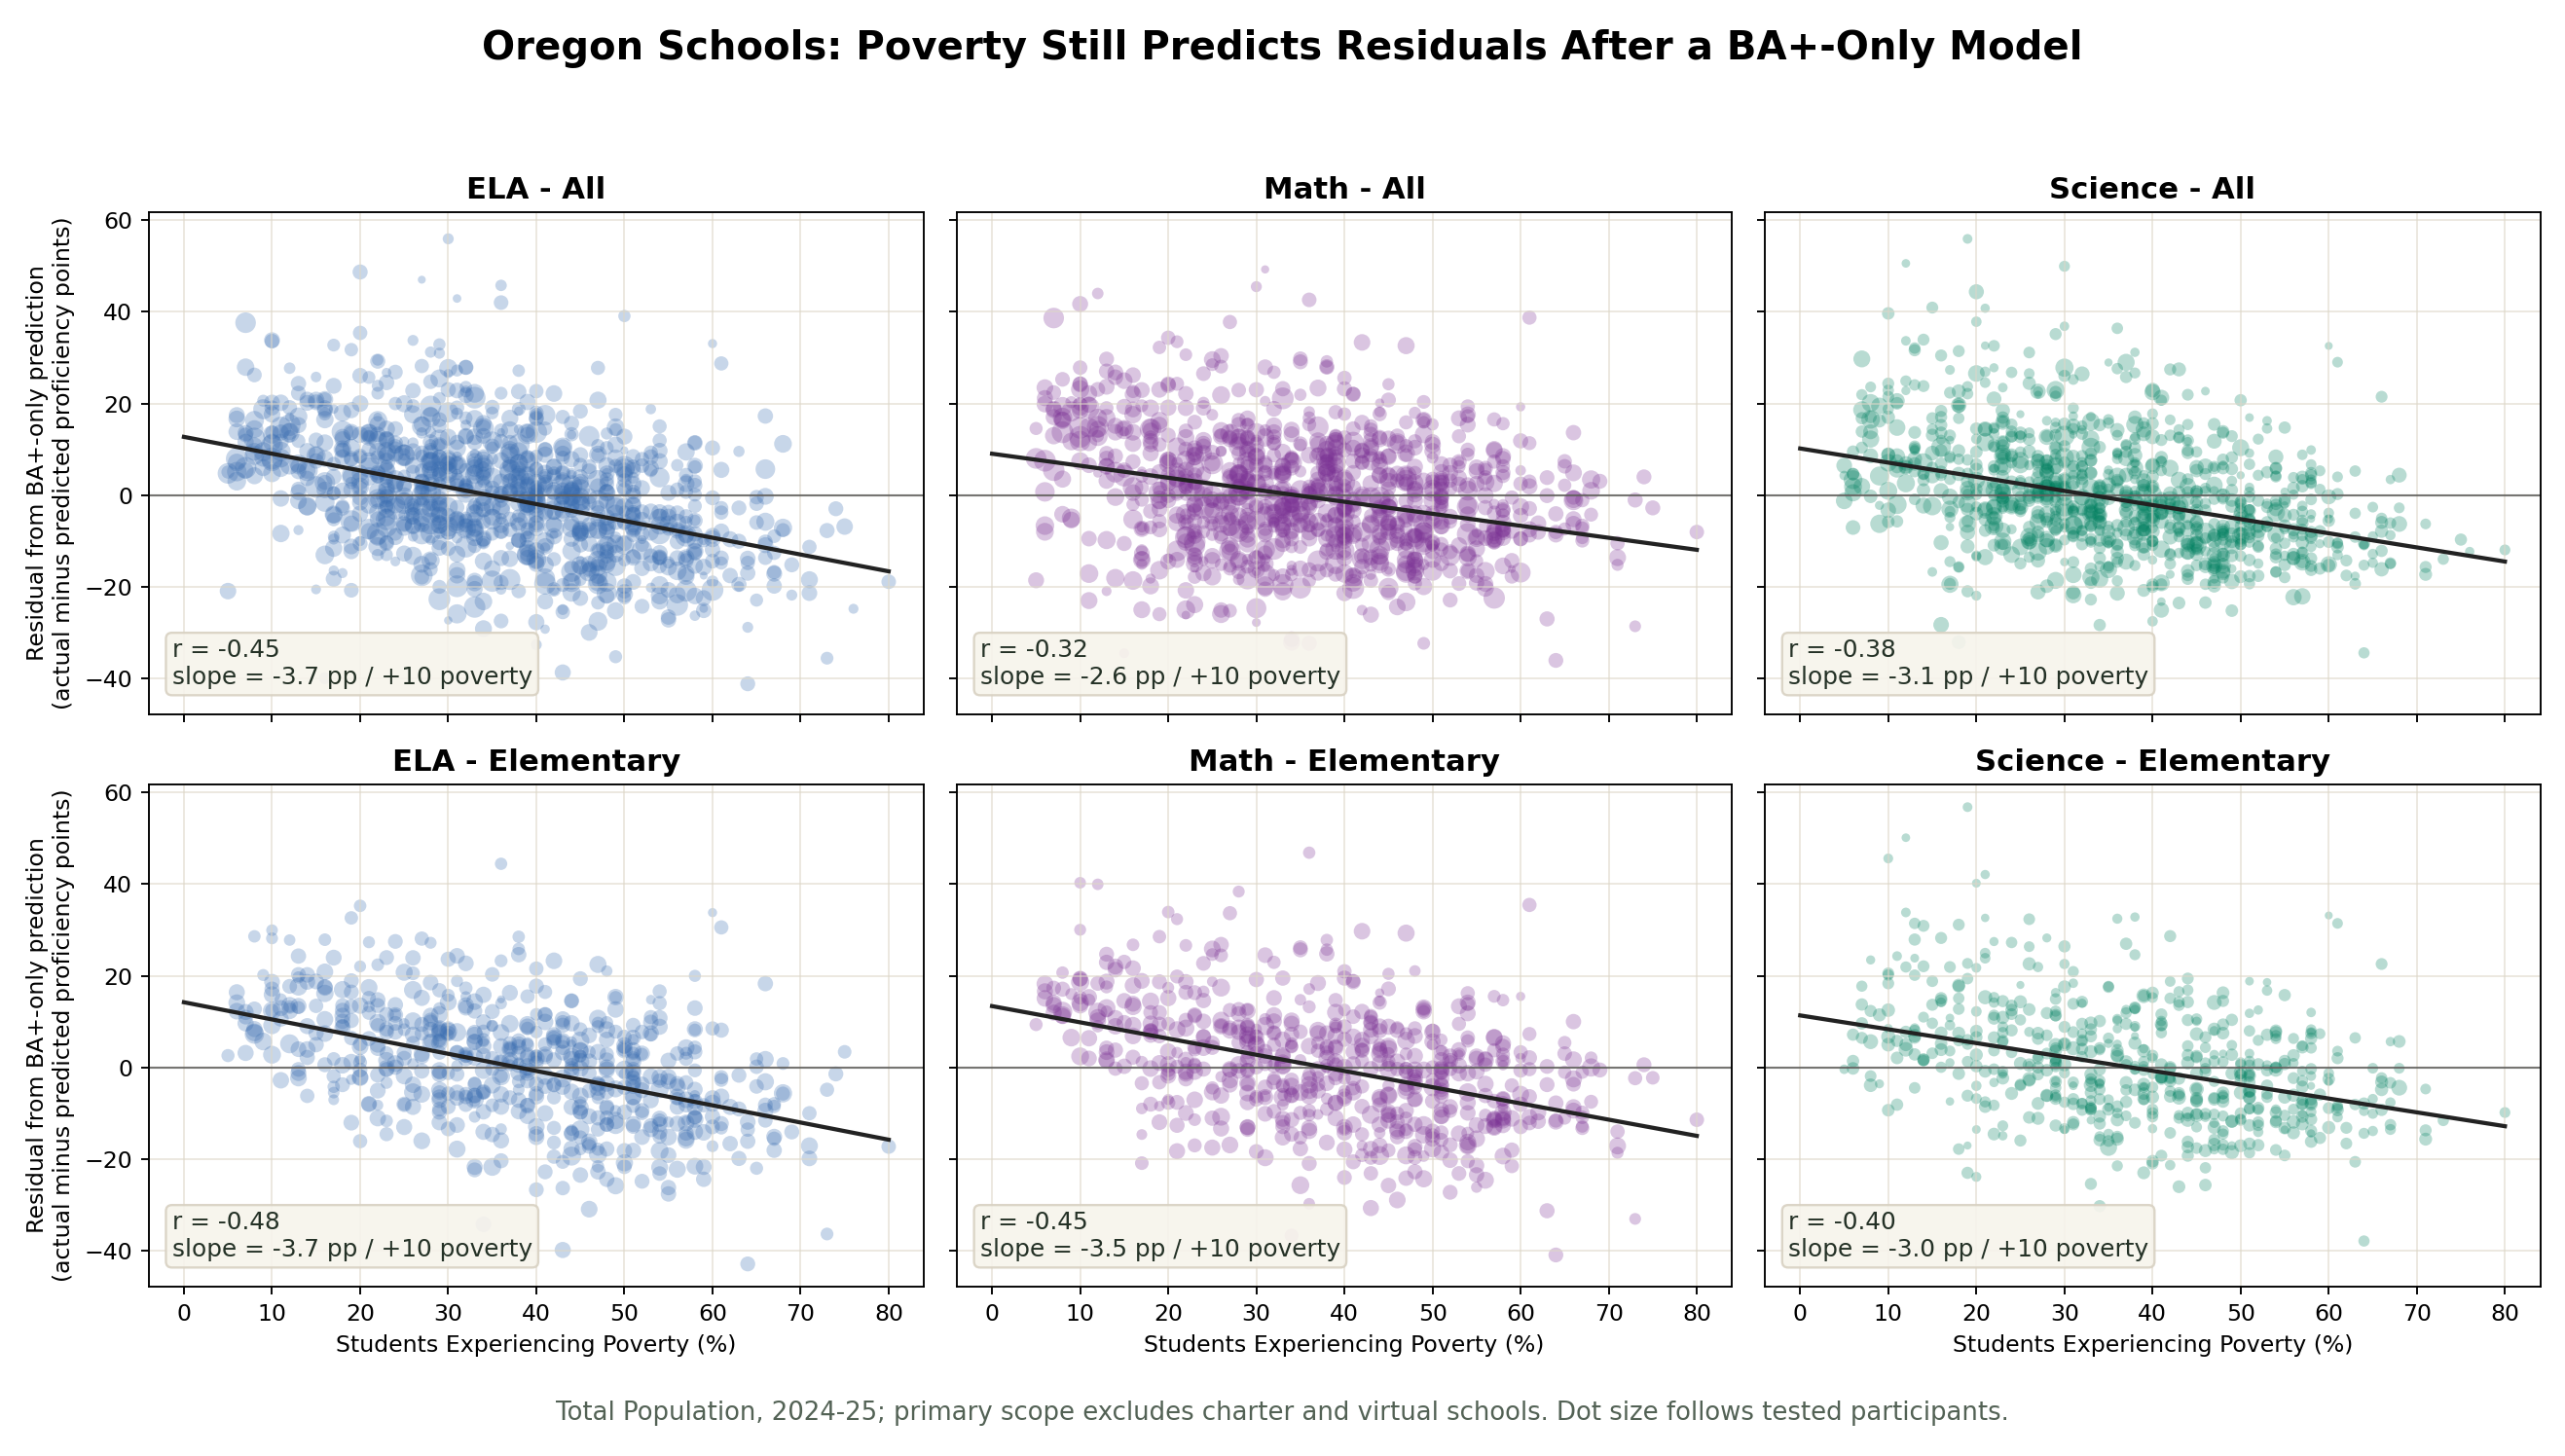
But adult BA+ does not disappear when student poverty is included in the same model. The cleaner reading is not
"BA+ is the single dominant factor." It is: adult BA+ is a strong community-context signal, and school poverty
is a strong enrolled-student hardship signal. The two overlap, but neither fully replaces the other.
0.596ELA joint model R2 using BA+ and school poverty together.
0.510Math joint model R2. BA+ and poverty are closer in unique strength here.
0.473Science joint model R2, with school poverty adding the larger unique signal.
What We Modeled
The model is intentionally simple: Percent Proficient is predicted from two variables, ACS adult BA+ rate and
ODE's school-sourced Students Experiencing Poverty measure. Rows are school-level aggregates for Total Population
students in 2024-25. Outcomes and model weights use students with scored Level 1-4 results. The primary view
excludes charter, virtual, and special-enrollment schools.
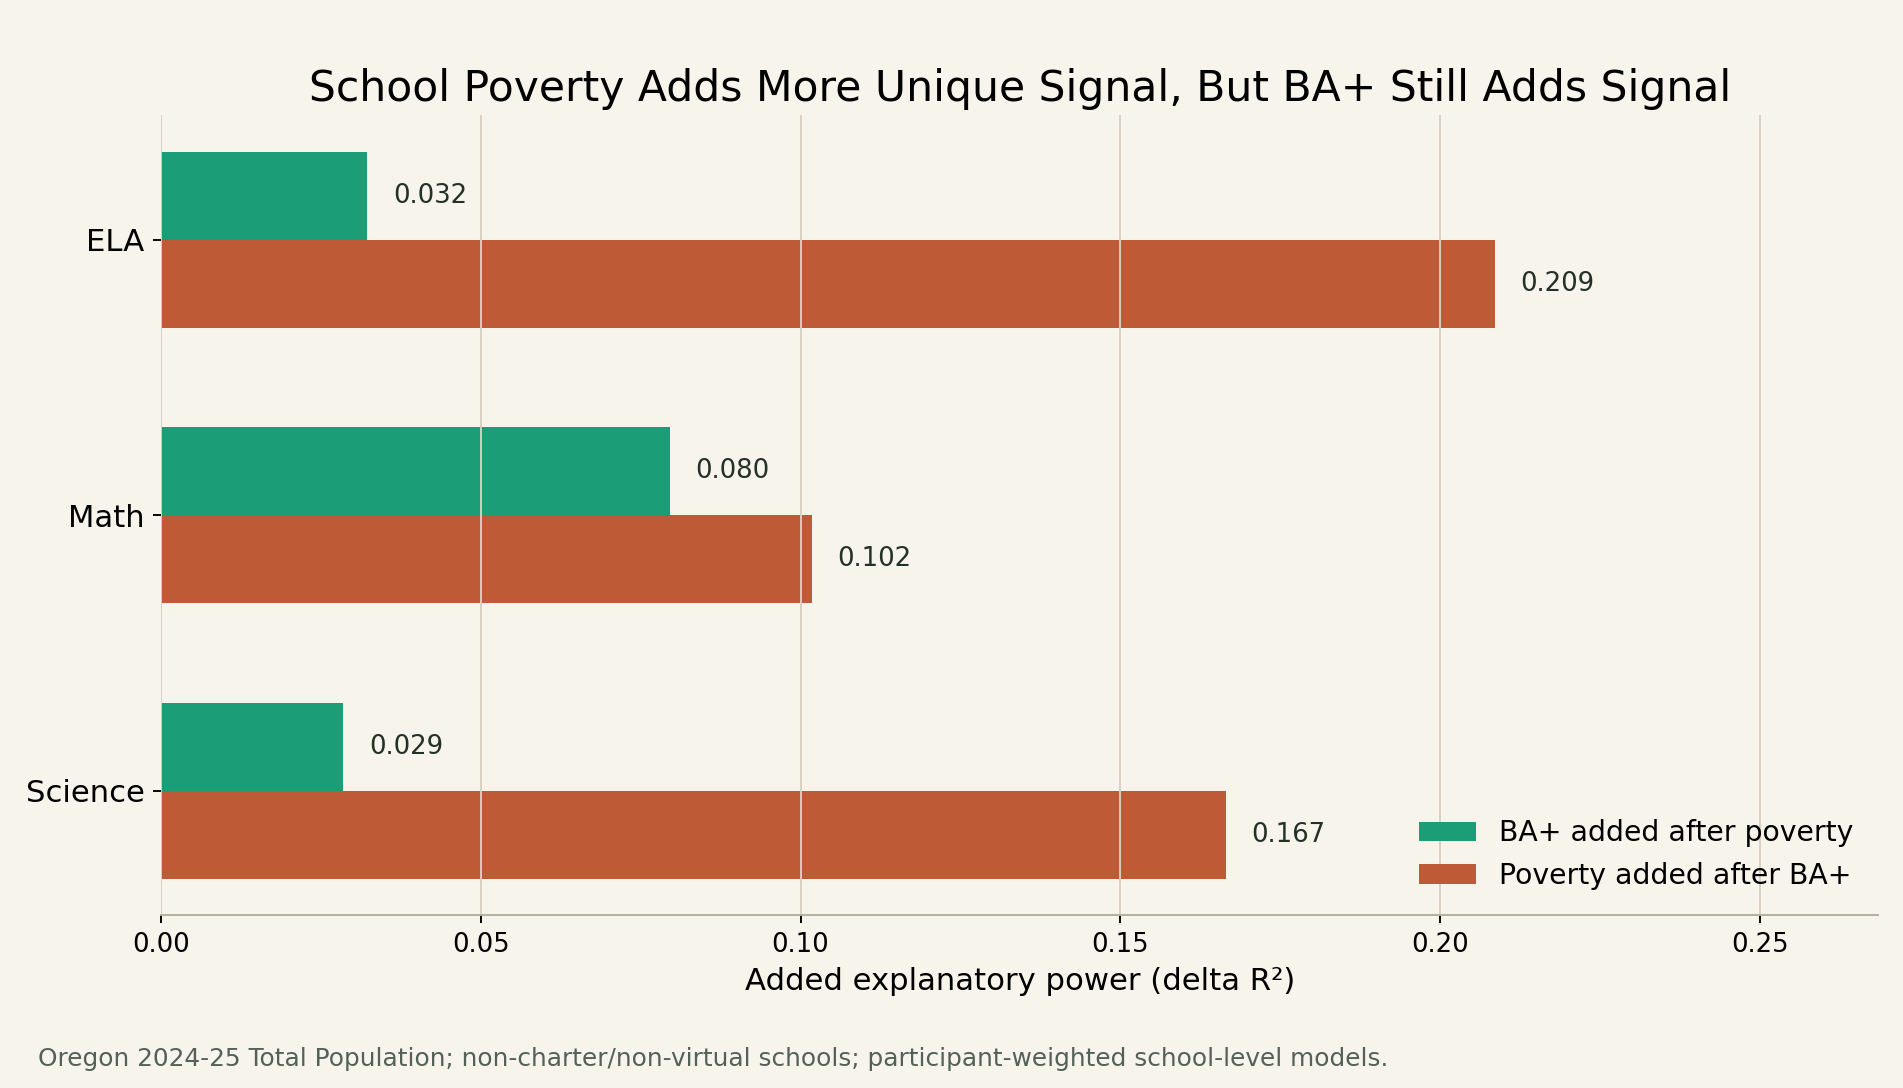
What Each Measure Adds After the Other
Added R2 measures how much explanatory power one variable contributes after the other is already in the model.
Poverty adds more unique signal in ELA and Science. BA+ remains meaningfully positive, especially in Math.
Primary Results
Subject
Schools
BA+ r
Poverty r
Joint R2
BA+ beta
Poverty beta
BA+ added R2
Poverty added R2
ELA
1,019
0.629
-0.748
0.596
0.252
-0.585
0.037
0.200
Math
993
0.644
-0.652
0.510
0.383
-0.404
0.085
0.095
Science
984
0.558
-0.664
0.473
0.229
-0.519
0.031
0.161
How to Read the Table
Correlation r is the simple weighted association before controls. BA+ is positive because higher BA+ is associated with higher proficiency. Poverty is negative because higher poverty is associated with lower proficiency.
Standardized beta compares each predictor on a common scale inside the same model. Larger absolute values indicate stronger unique association after the other predictor is held fixed.
Added R2 asks how much one measure improves the model after the other measure is already included.
Interpretation
Adult BA+ remains a robust indicator of community educational context, but school poverty often carries more
unique explanatory signal in 2024-25 Oregon data. The right conclusion is not that one measure makes the other
irrelevant. It is that statewide performance patterns are better described with both: one broad
community-education measure and one enrolled-student hardship measure.
Caution: These are school-level observational associations, not causal estimates.
BA+ is attached to school geography rather than individual students or exact attendance areas. Students Experiencing
Poverty is closer to the enrolled school population, but it is still a school-level measure.
Related Evidence
SES explorations summary: a synthesis of income, education, poverty, and other SES proxy checks.
BA+ signal in high-poverty schools: a banded analysis showing that the BA+ slope remains positive but is much weaker in high-poverty schools.
Why poverty can outpredict income: a plain-language explanation of why a school-population poverty field can outperform a tract-level income measure.
Income vs poverty reassessment: a poverty-aware model comparison using BA+, attendance, income, and Students Experiencing Poverty.