Andrew Ho argues that proficiency percentages can be technically correct yet misleading because they summarize a score distribution at one cut score. This report asks what that concern means for Oregon's 2024-25 school achievement analyses, where the main summary outcome is usually Percent Proficient.
Proficiency threshold sensitivity
Ho-style read of Oregon 2024-25 achievement levels.
- Data: Oregon 2024-25 school achievement rows from the processed ELA, math, and science files.
- Rows: Total Population, grade-specific rows only; All Grades science rows are excluded to avoid double-counting.
- Filters: charter, virtual, and curated special-enrollment schools excluded.
- Aggregation: school-subject totals across tested grades, using achievement-level counts.
- Inclusion threshold: at least 30 students with reported Level 1-4 results after aggregation.
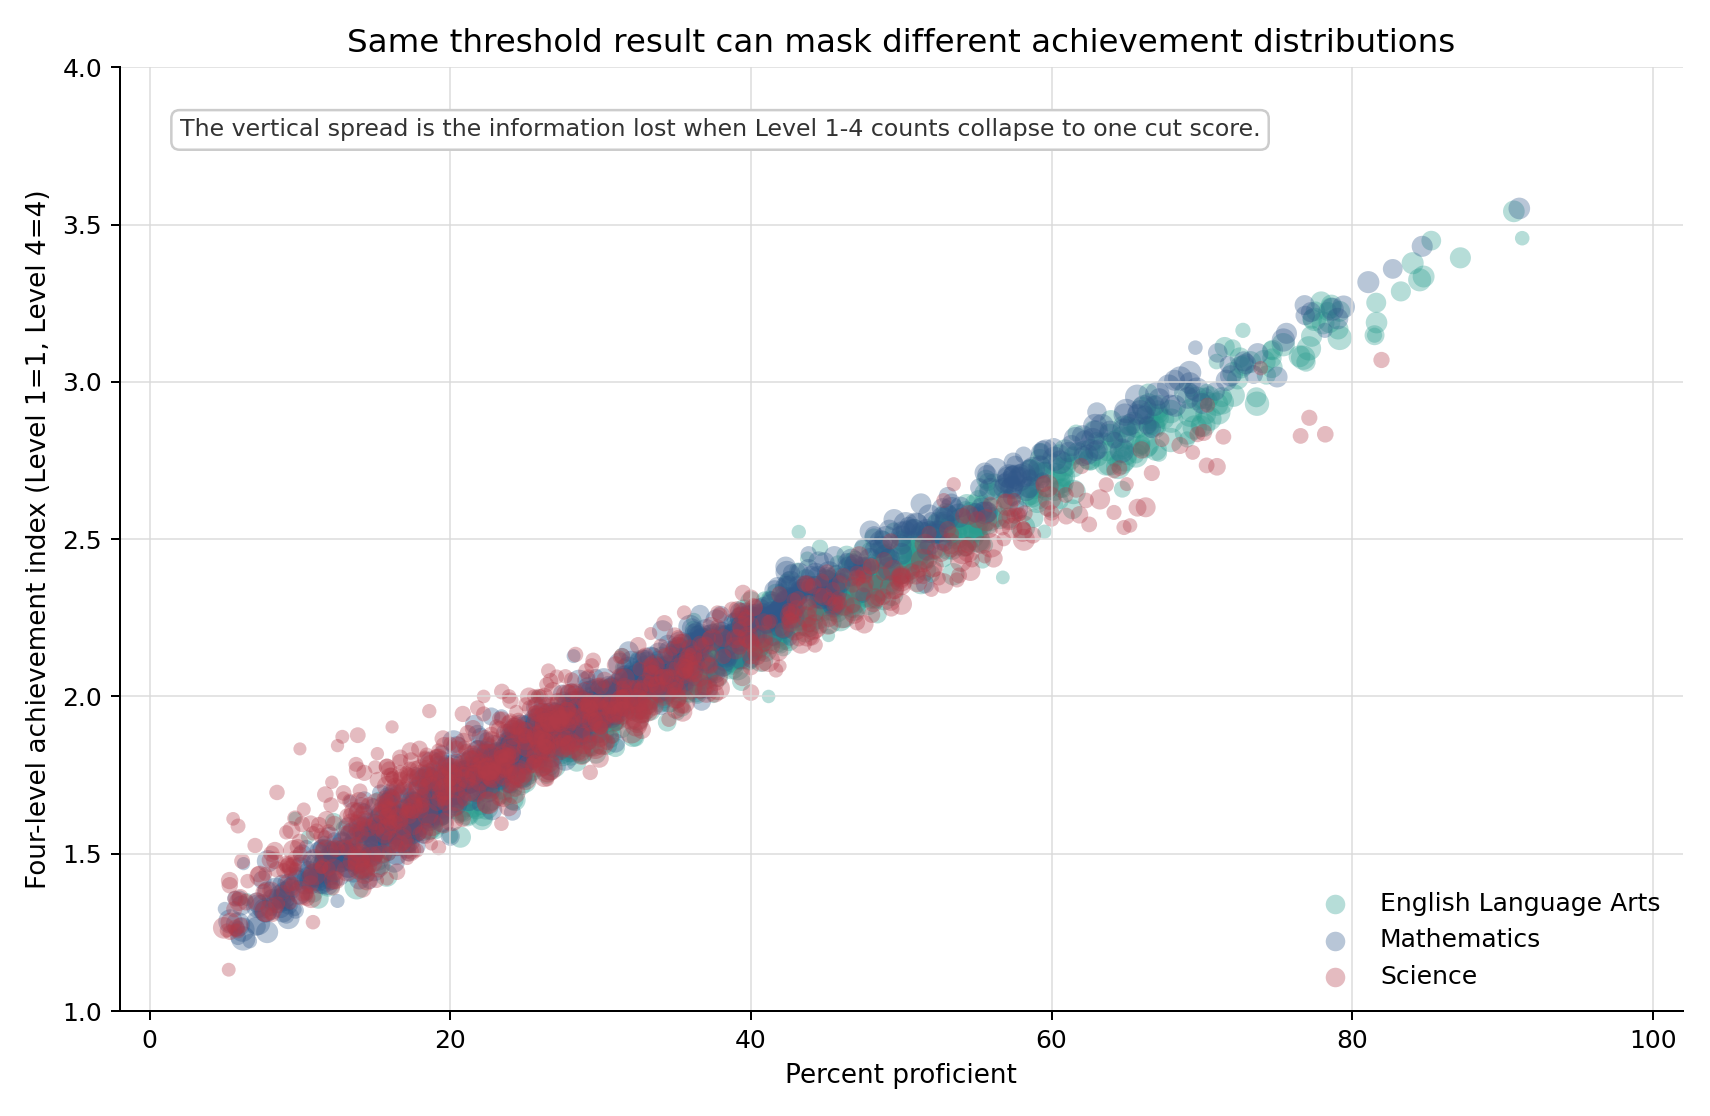
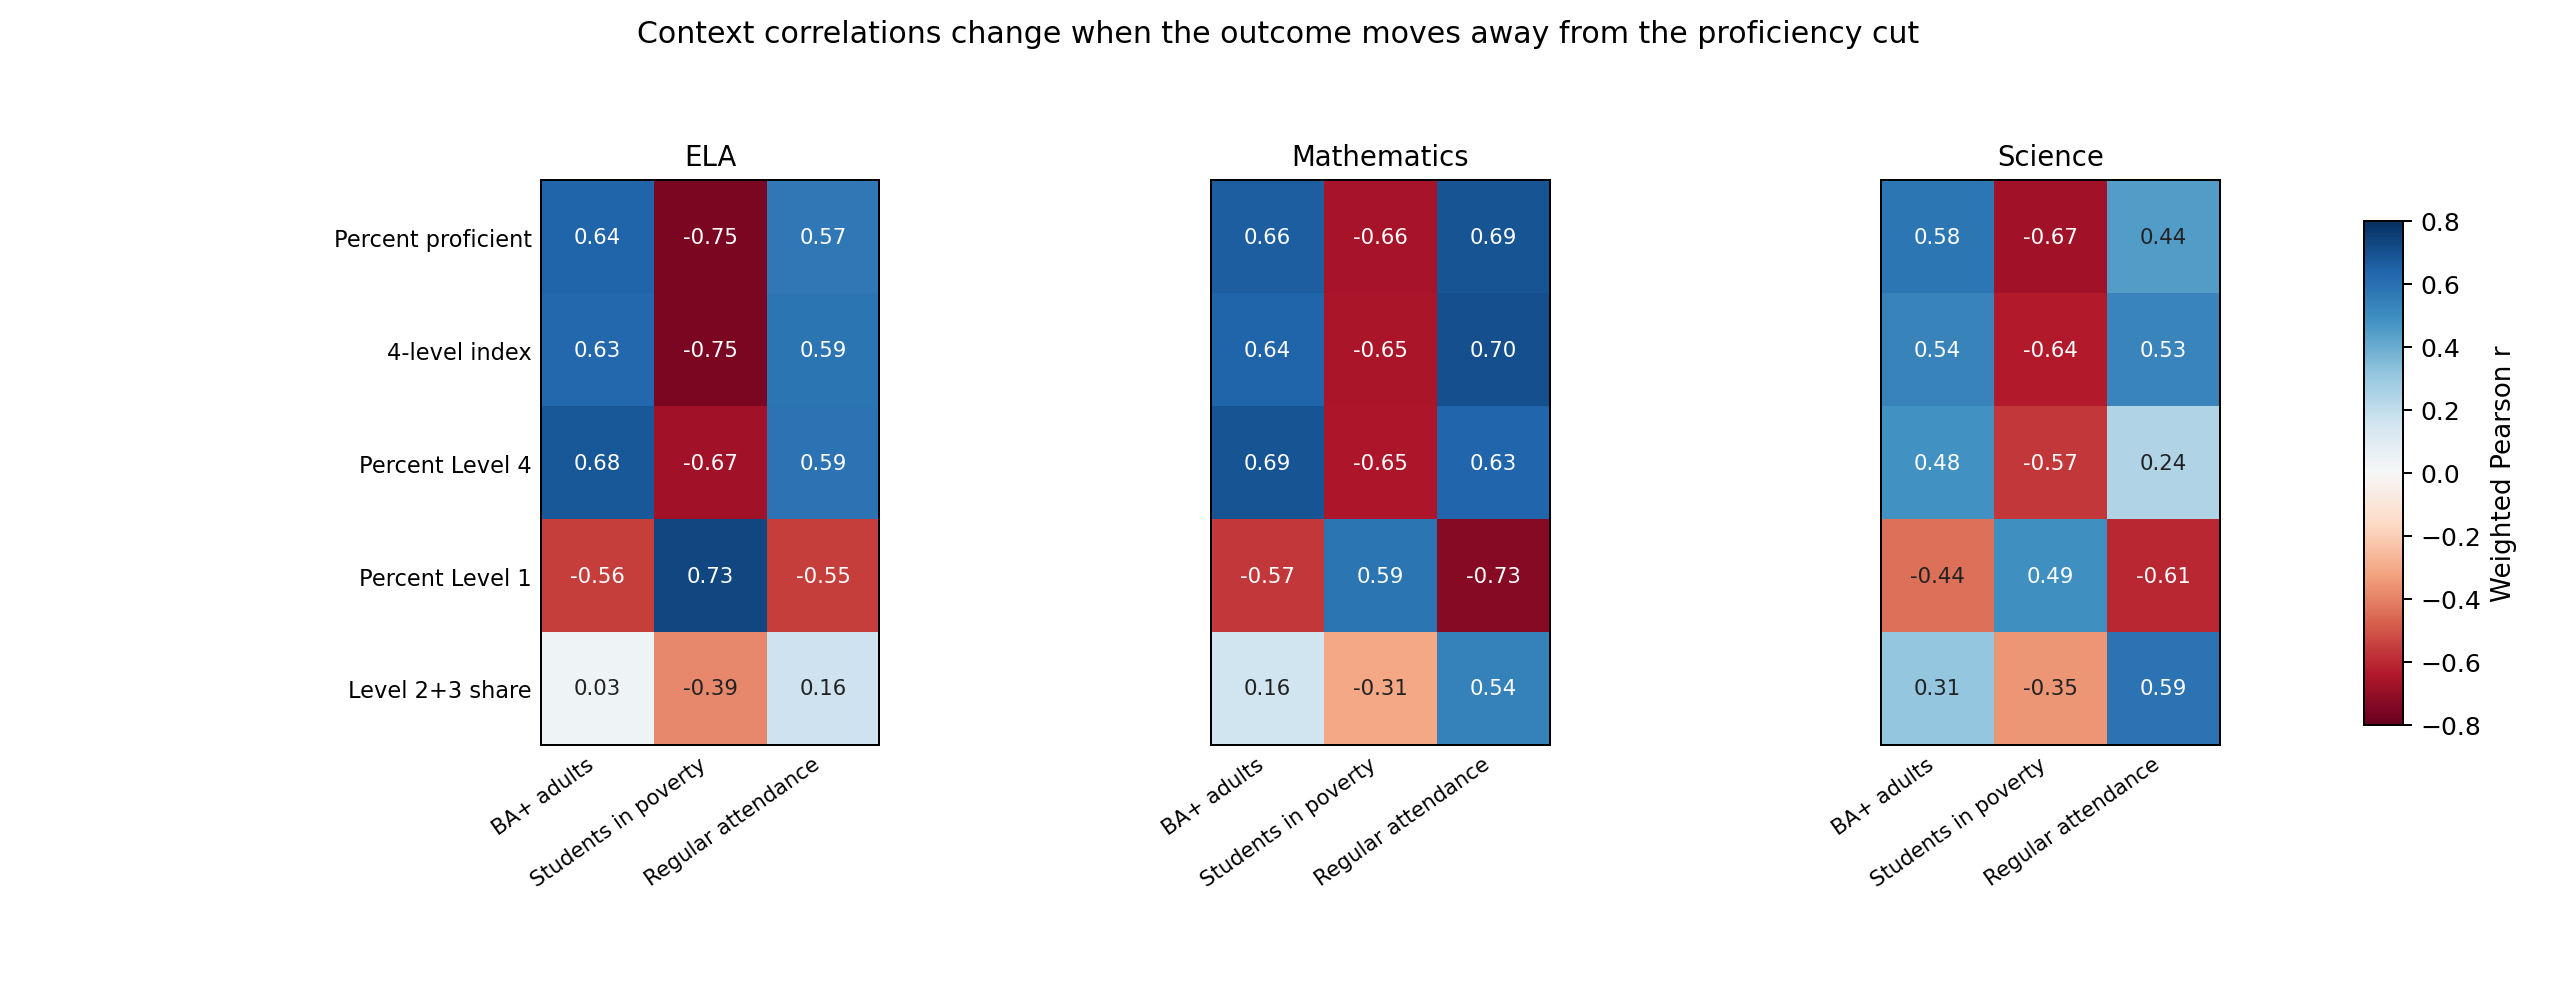
Ho's warning applies, but it does not overturn the broad SES findings. Percent Proficient is Oregon's Level 3 plus Level 4 share, so it hides whether students are concentrated in Level 1 versus Level 2 or Level 3 versus Level 4. When the same data are summarized with a simple four-level index, adult BA+ context, student poverty, and attendance remain strongly associated with achievement.
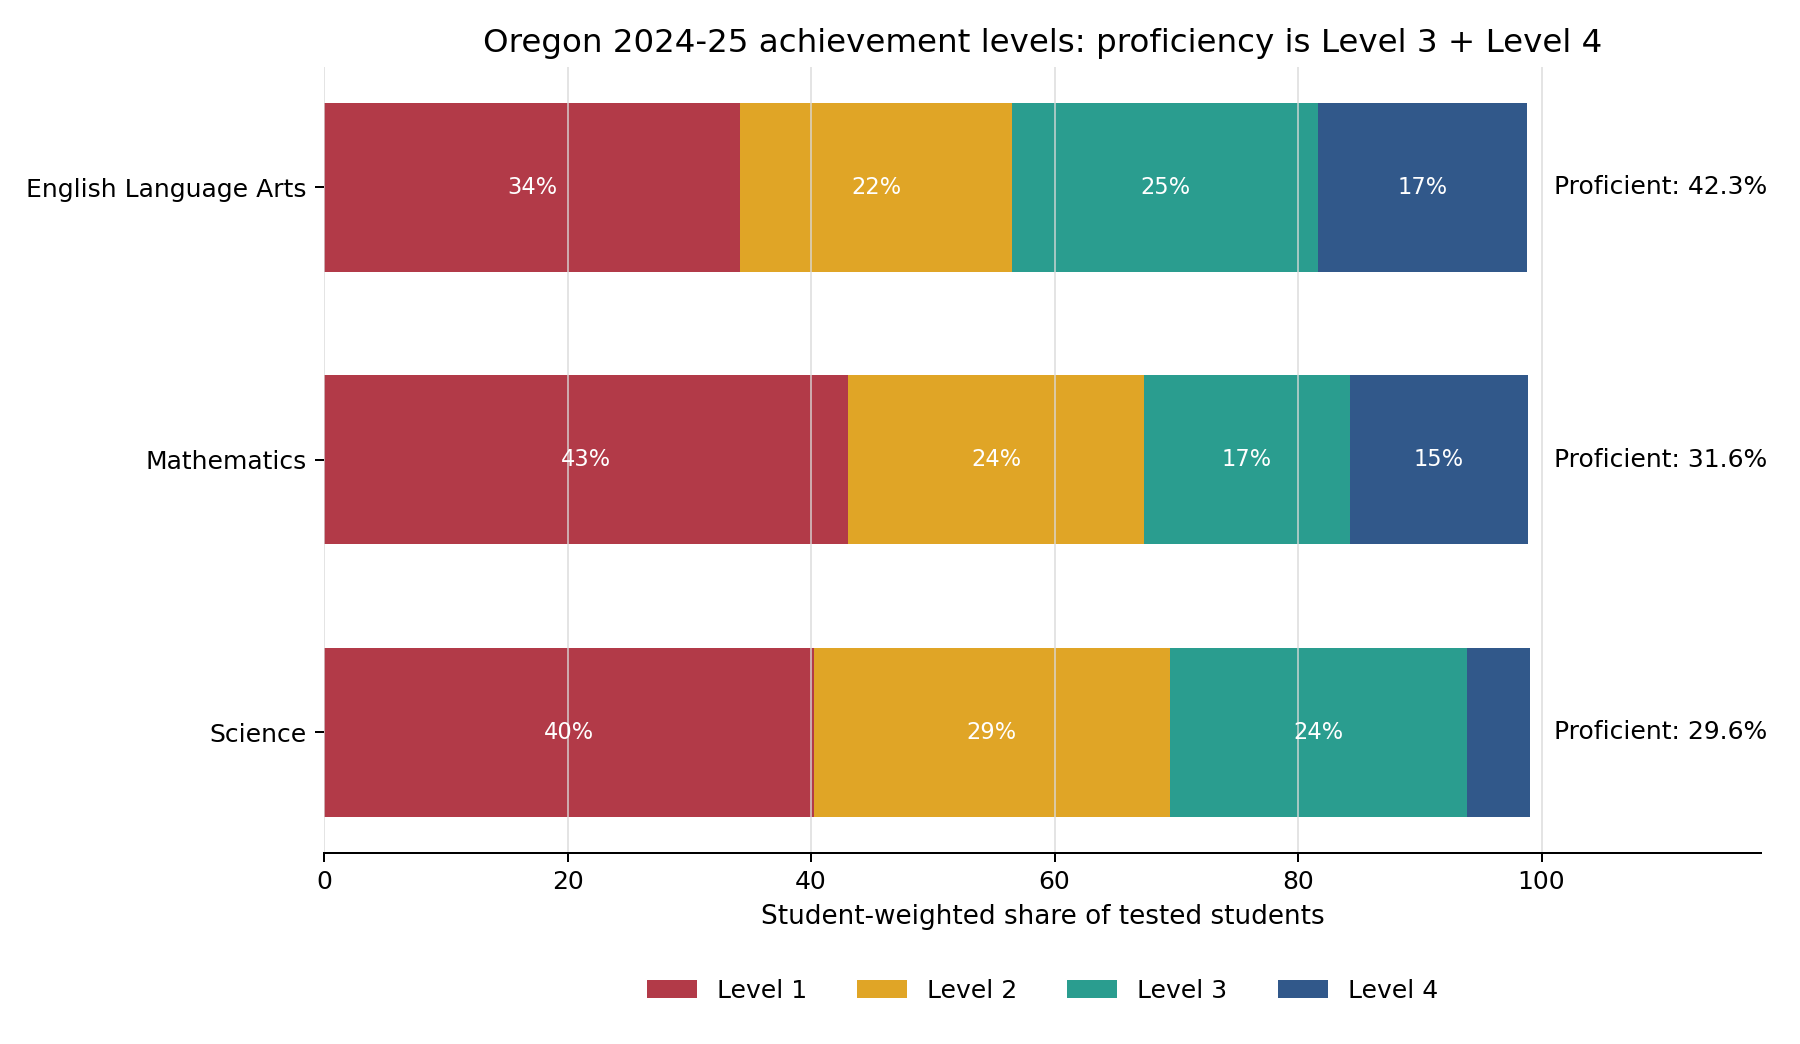
The index assigns Level 1 = 1, Level 2 = 2, Level 3 = 3, and Level 4 = 4, then averages those values using student counts. It is not an official scale score. It is a sensitivity check that asks whether the same SES relationships appear when all four achievement buckets are used instead of only the Level 2/3 proficiency cut. All percentages and analysis weights use students with reported Level 1-4 results.
- ELA: Percent Proficient correlations are BA+ +0.65, poverty -0.75, attendance +0.57; the four-level index is +0.64, -0.75, +0.59.
- Math: Percent Proficient correlations are BA+ +0.66, poverty -0.65, attendance +0.69; the four-level index is +0.65, -0.64, +0.70.
- Science: Percent Proficient correlations are BA+ +0.58, poverty -0.67, attendance +0.45; the four-level index is +0.54, -0.63, +0.53.
Because the equal-spacing assumption is unproven, the analysis tested alternate scoring rules: extra Level 4 premiums, stronger Level 1 penalties, a compressed middle, and a near-pass-friendly Level 2 score. Across those core alternatives, the SES correlations stayed in the same range: BA+ remained positive, poverty remained negative, and attendance remained positive. The exact index value is not sacred, but the main SES association is not driven by the equal-spacing assumption.
- Percent Proficient remains useful as a descriptive snapshot, but it should not carry the whole evidentiary load.
- Statewide SES findings look robust to the four-level index and to alternate level-spacing rules.
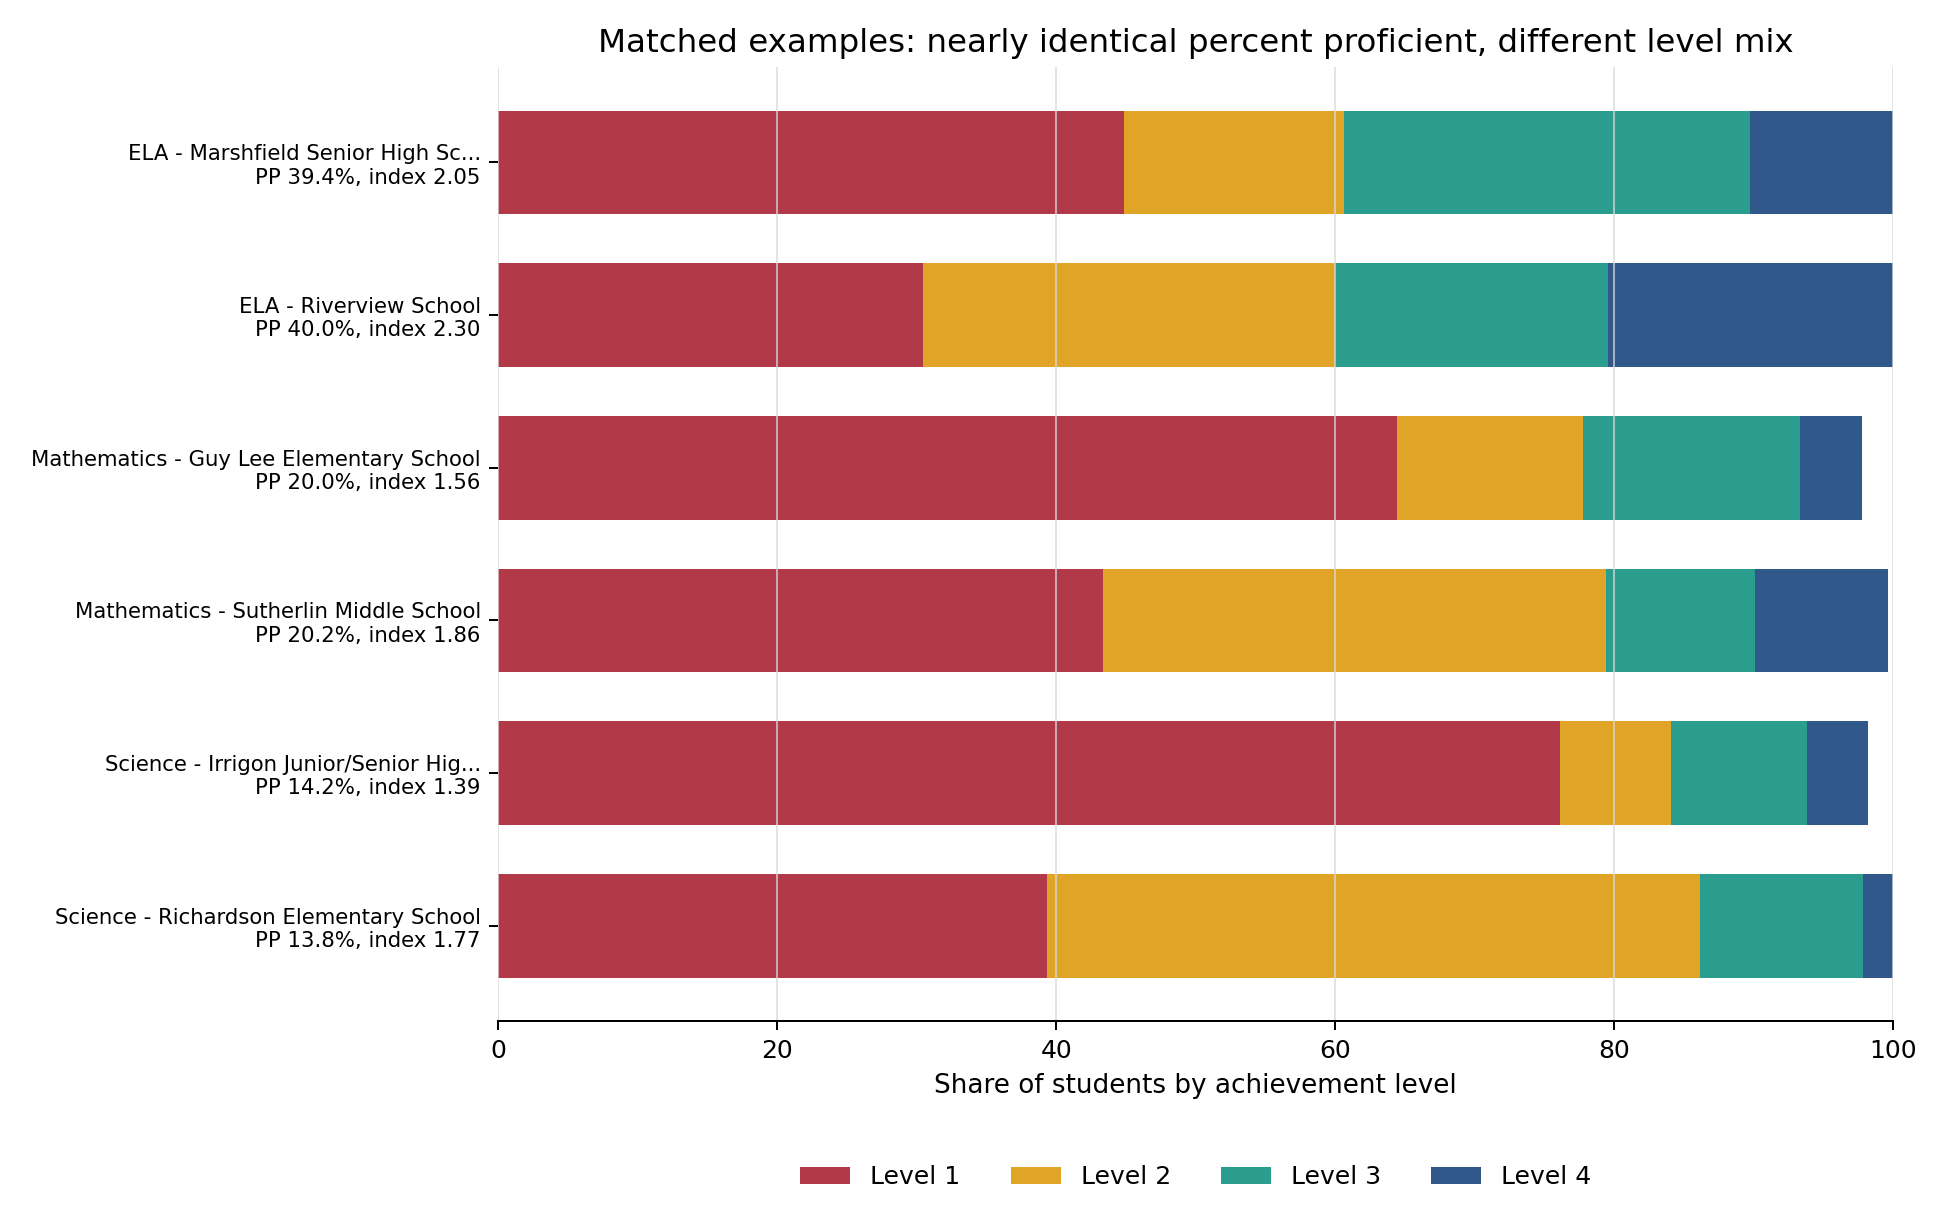
- Individual school comparisons need more caution: pair proficiency with Level 1, Level 4, or stacked Level 1-4 distributions.
- Trend claims remain the hardest case because school-level public data do not provide scale-score means or percentile points.
Ho, A. D. (2008). The problem with "proficiency": Limitations of statistics and policy under No Child Left Behind. Educational Researcher, 37(6), 351-360. https://doi.org/10.3102/0013189X08323842