Adult Education and Student Test Performance
A statewide elementary-school-site view of how nearby adult education levels track math proficiency.
What this shows
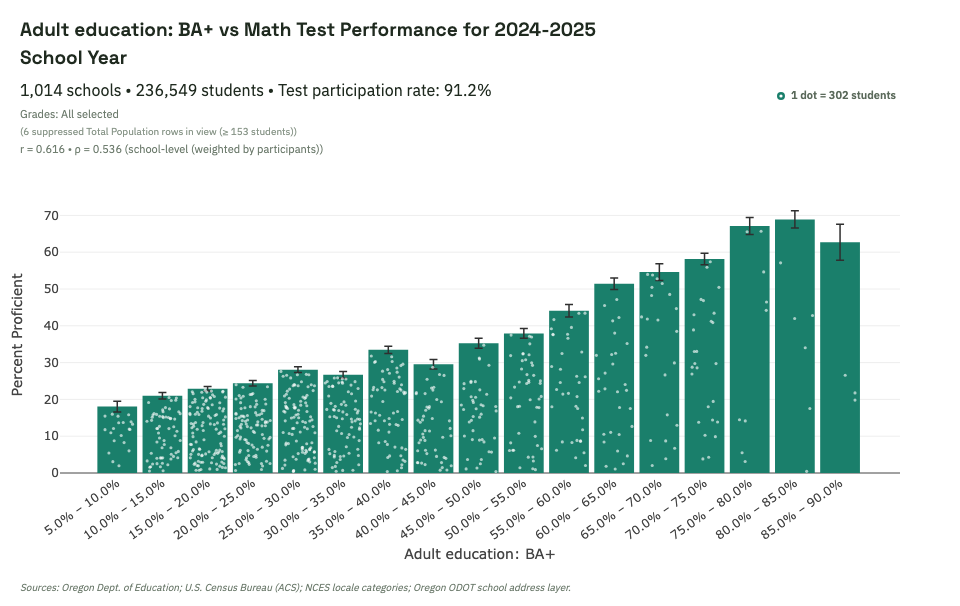
Among elementary school sites, math proficiency generally rises as the adult BA+ rate in the school site's Census tract rises. Dot size reflects the official All Grades scored-student count; the legend gives the scale.
What to look for in the live view
- Whether the upward pattern remains across most bins, not just the tails.
- How much the slope changes when you filter by locale or district.
- Where uncertainty widens because scored-student counts are smaller.
Interpretation caution: Elementary eligibility means the school's observed 2024-25 Total Population tested-grade profile across English, math, and science is confined to grades 3-5. The school-site Census tract is a neighborhood proxy, not an attendance-area or student-residence measure, and the association is not causal.
Explore this view live
Ready to test this pattern yourself? Open this exact dashboard view, then adjust filters and compare alternatives.