Class Size and Test Performance
Statewide class-size patterns look weaker and less regular than relationships involving attendance, adult education, or income.
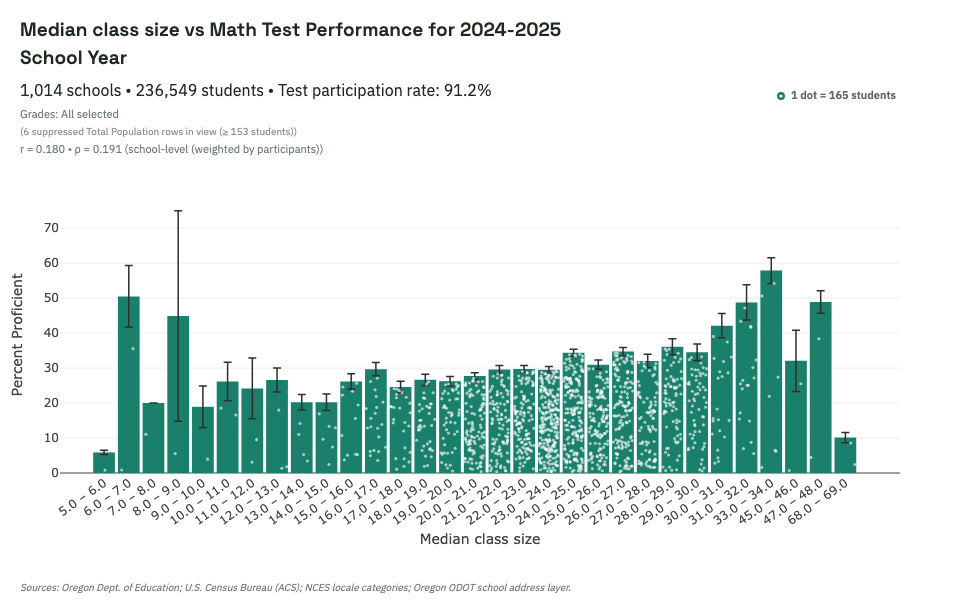
What this shows
Compared with attendance, adult education, and income, class-size patterns are less coherent at broad statewide scale.
How to interpret it
- A weak visual trend does not prove no effect; it may indicate smaller effects, mixed effects, or confounding.
- Try district subsets and grade filters to see whether local patterns differ from statewide structure.
- Compare class size with spending measures to see whether either shows a clearer statewide pattern.
Interpretation caution: Broad averages can hide subgroup behavior. Treat this page as a first-pass descriptive check.
Explore this view live
Ready to test this pattern yourself? Open this exact dashboard view, then adjust filters and compare alternatives.