Compare Performance Across Oregon Districts
A statewide district comparison that keeps the full Level 1-4 distribution visible.
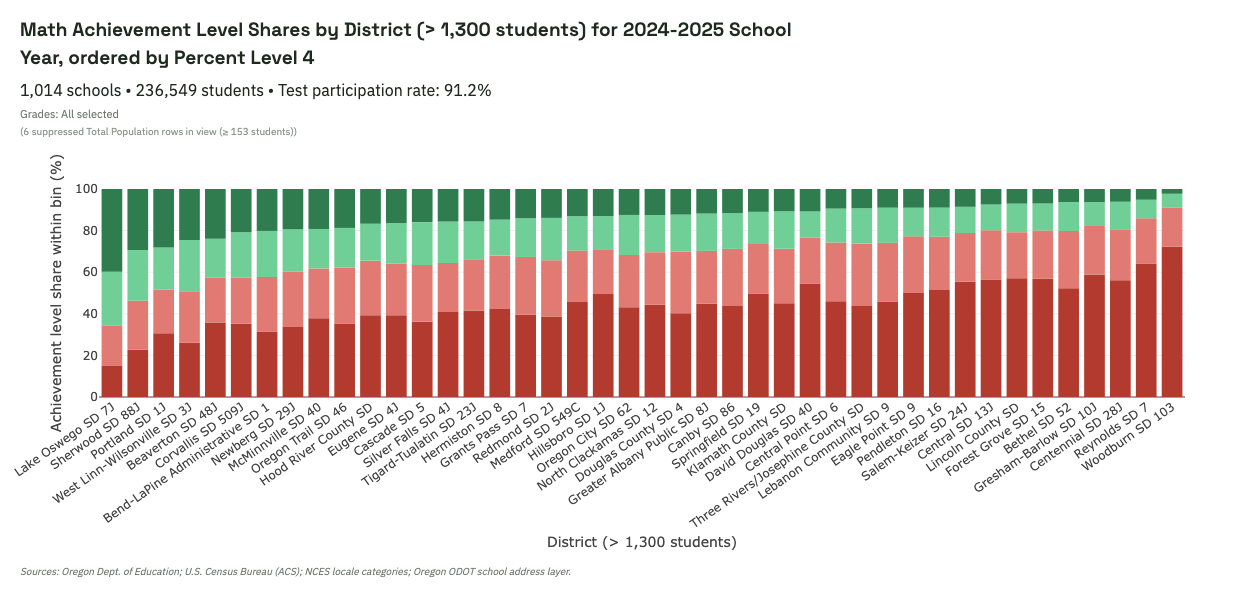
What this shows
Districts are ordered by Percent Level 4 while each bar still shows the full Level 1–4 mix. This helps compare both top-end performance and lower-level concentration at the same time.
What to look for in the live view
- How much Level 1 expands as Level 4 contracts across districts.
- Whether Level 2 and Level 3 stay relatively stable or also shift substantially.
- Districts with similar Level 4 values but very different lower-level distributions.
Interpretation caution: District-level differences are descriptive patterns. They can reflect demography, enrollment composition, suppression effects, policy choices, and local conditions.
Explore this view live
Ready to test this pattern yourself? Open this exact dashboard view, then adjust filters and compare alternatives.