Geographic and Demographic Distribution of Scores
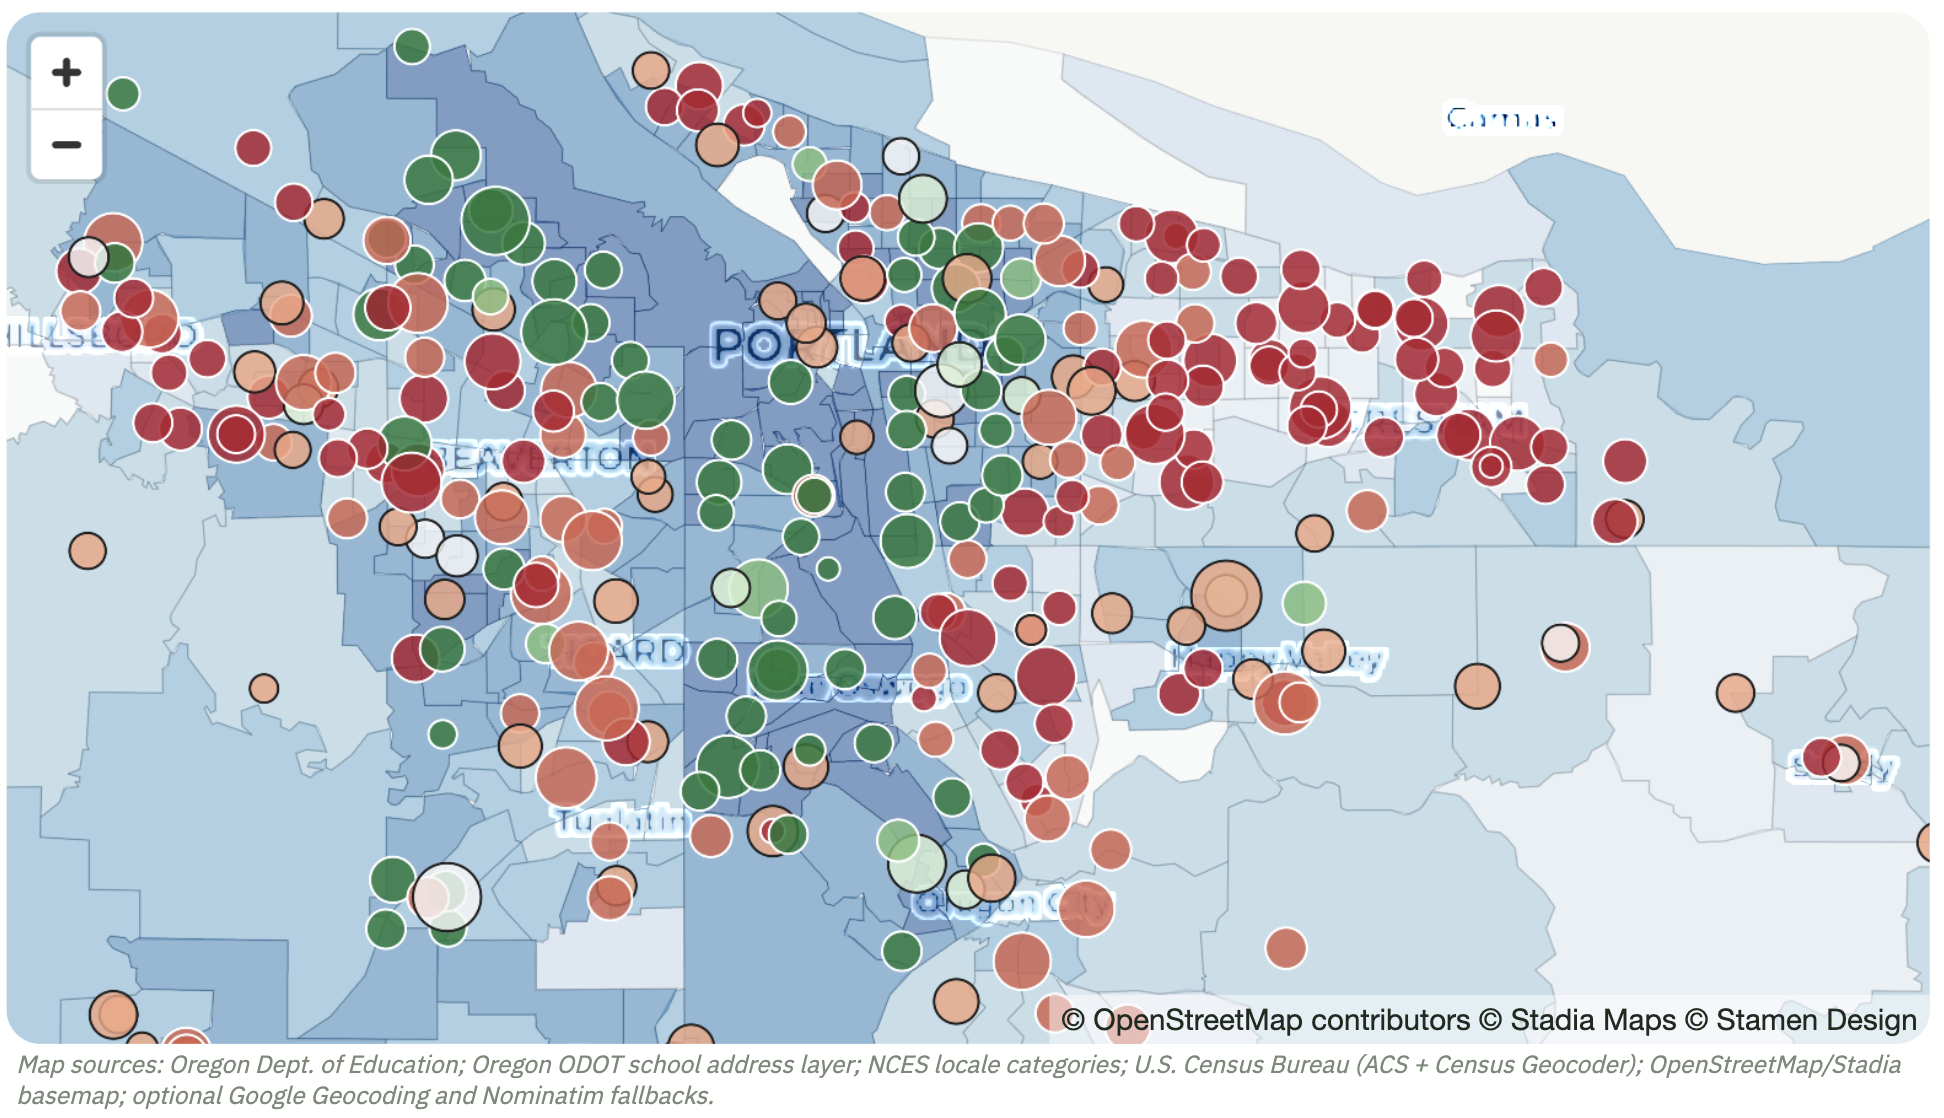
A Portland-area map pairing school outcomes with tract-level adult education levels.
What this shows
In this snapshot, schools with higher proficiency rates (greens) often appear in or near higher-BA+ tracts.
How to use this view
- Pan and zoom to compare local patterns across corridors and neighboring Census tracts.
- Toggle clustering and legend options to inspect local structure at different scales.
- Switch tract overlays to compare the education and income overlays directly.
Interpretation caution: Spatial overlap is suggestive, not definitive. Nearby schools can still differ for reasons this map does not encode.
Explore this view live
Ready to test this pattern yourself? Open this exact dashboard view, then adjust filters and compare alternatives.