Demographic Gradients Appear Across Grade Levels
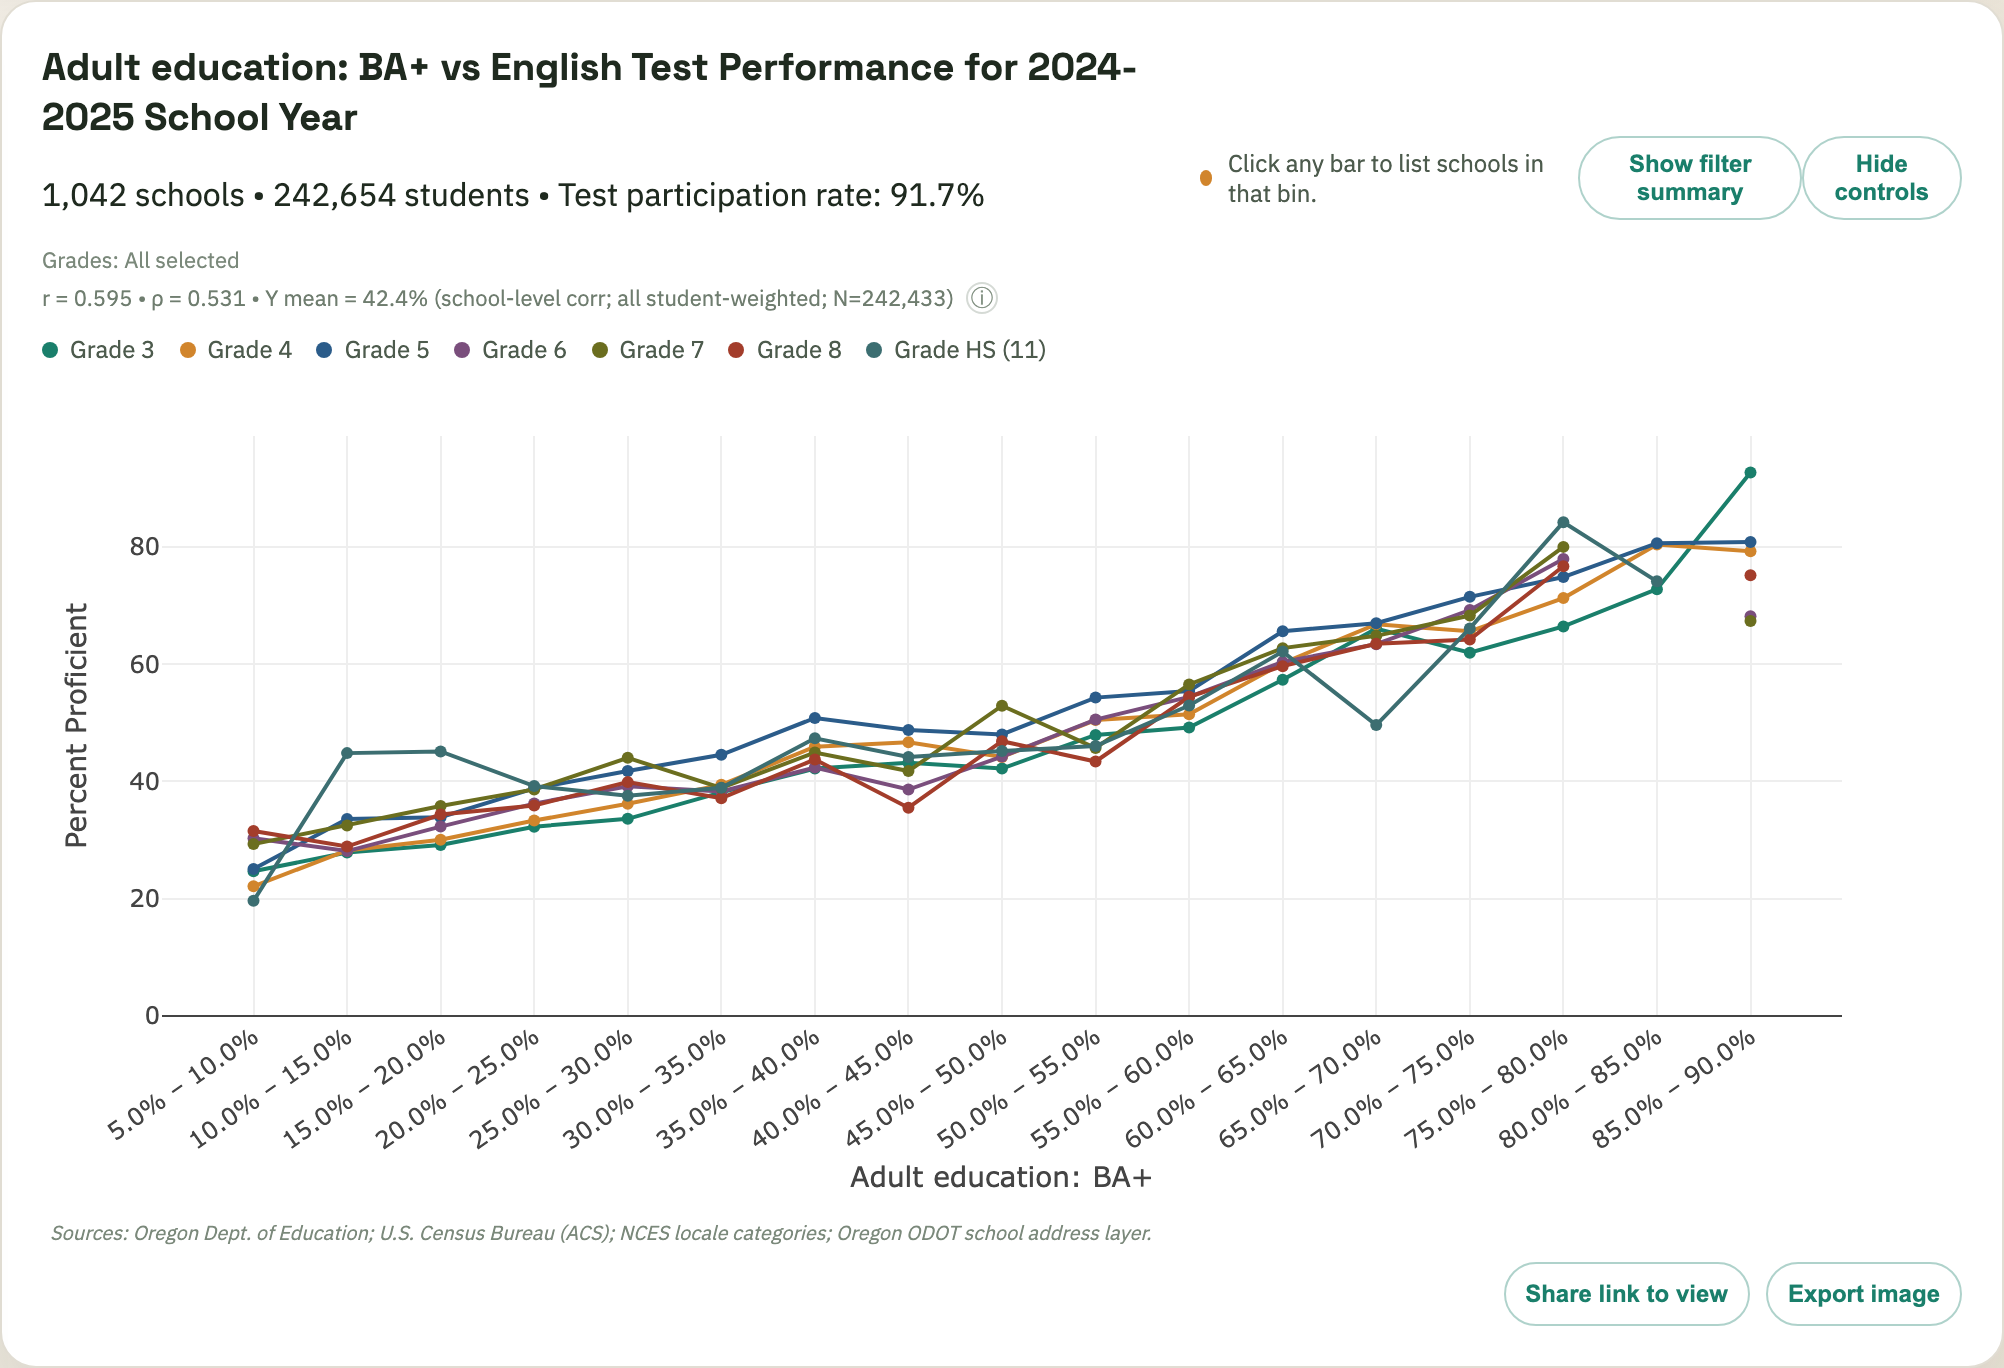
A statewide school-grade view showing that English proficiency follows the same broad demographic gradient across grade levels.
What this shows
Each grade-level line tells roughly the same story: schools in areas with lower adult BA+ rates tend to have lower English proficiency, while schools in areas with higher rates tend to have higher proficiency. The important point is not that one grade looks unusually weak or unusually strong, but that the broad relationship appears across the grade span.
What to look for in the live view
- Whether most grade-level lines show the same left-to-right climb, even if they sit at slightly different levels.
- Which adult-BA+ bins remain below 50% proficient across most grades.
- Whether any grade actually breaks from the demographic pattern, or mostly shifts it up or down.
Interpretation caution: This school/community pattern does not determine any individual student's result. Grade-level lines compare different school-grade records, not the same students over time.
Explore this view live
Ready to test this pattern yourself? Open this exact dashboard view, then adjust filters and compare alternatives.