Household Income and Test Performance
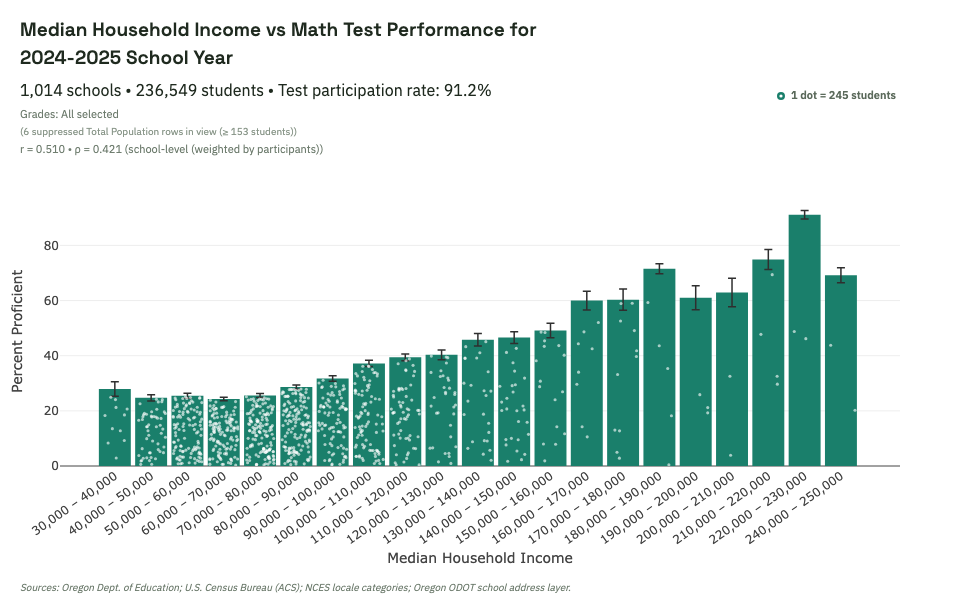
A statewide elementary-school-site view of school-site tract household income and math proficiency.
What this shows
Among elementary school sites, proficiency tends to increase as median household income in the school site's Census tract rises. The gradient is visible across much of the range, not just at the lowest or highest bins.
What to check in the live view
- Whether the gradient remains after district and locale filtering.
- How noisy the low- and high-income tails are compared with the middle bins.
- How closely this pattern resembles the education and attendance views.
Interpretation caution: Elementary eligibility means the school's observed 2024-25 Total Population tested-grade profile across English, math, and science is confined to grades 3-5. School-site tract income is a neighborhood proxy, not an attendance-area or student-residence measure; treat the pattern as an association, not a mechanism or causal effect.
Explore this view live
Ready to test this pattern yourself? Open this exact dashboard view, then adjust filters and compare alternatives.