Statistical reports and source scripts
A reader-friendly synthesis of the numeric analyses behind the Evidence Lab findings,
followed by grouped links to detailed reports, source scripts, figures, and machine-readable outputs.
Scope reminder: the primary models use one official 2024-25 all-tested-grades row for each
ordinary elementary school site. Results are weighted by scored students. Middle-school results are separate
sensitivities; high and combined-grade sites are excluded from the primary tract-SES interpretation.
These are school-level associations and predictive checks, not causal estimates.
At a glance
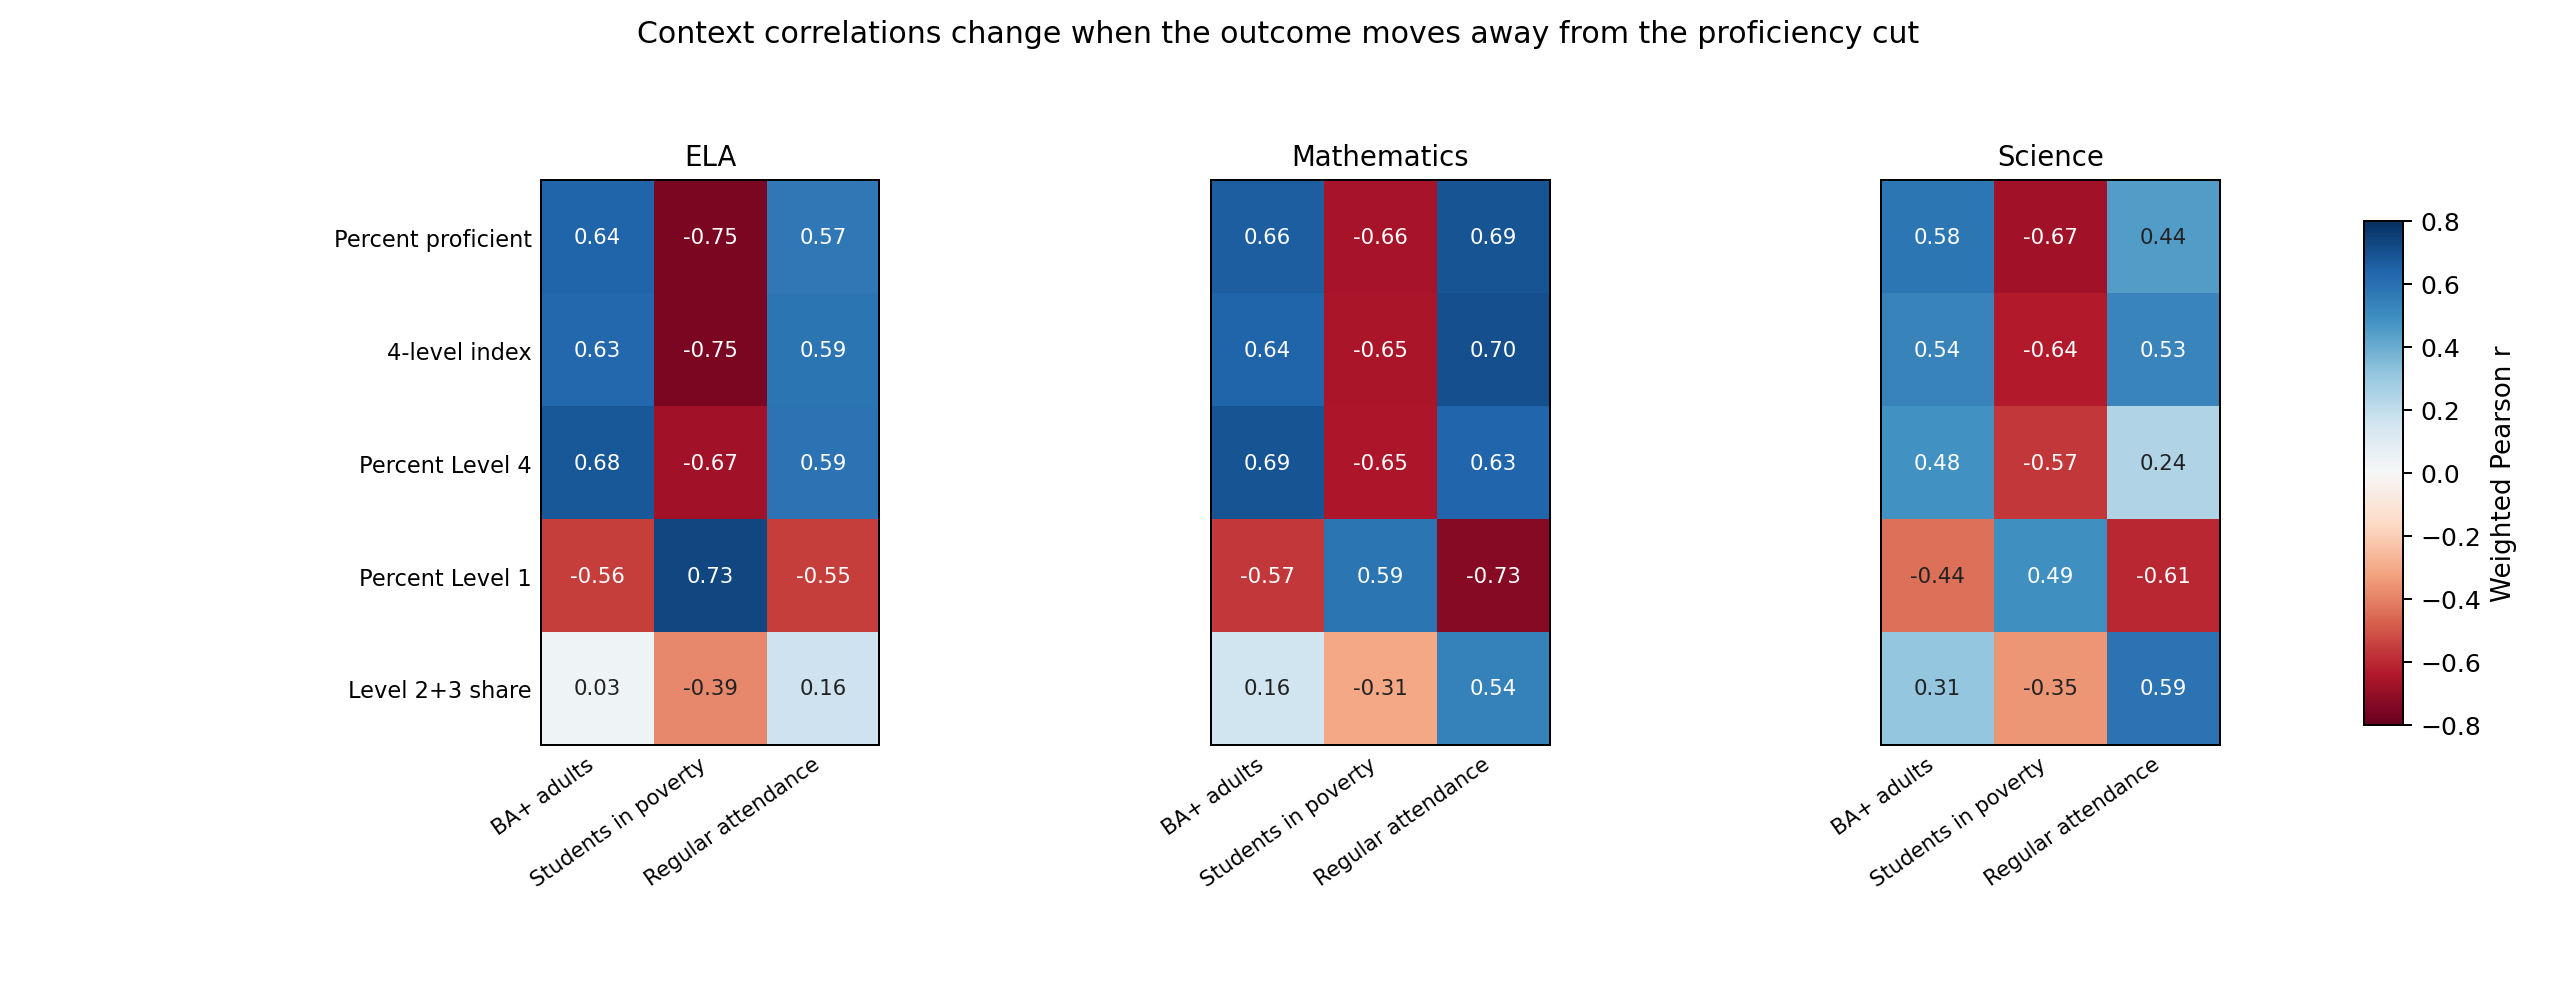
- The strongest recurring school-level associations involve student poverty concentration, attendance, and local adult BA+ levels.
- Income remains correlated with outcomes, but adds comparatively little after adult BA+, attendance, and student poverty.
- ODE Students Experiencing Poverty is the strongest enrolled-student hardship measure in the audited elementary specifications.
- Spending/class-size effects are weaker and less stable in statewide cross-sectional models.
- The adult-education-over-income ordering remains stable across repeated elementary half-sample checks.
Model setup
- Primary unit: one official Total Population All Grades row per ordinary elementary school.
- Weights: Scored Performance Denominator for 2024-25 achievement models.
- Attendance must match the assessment population; censored or unavailable rates are omitted without midpoint or whole-school substitution.
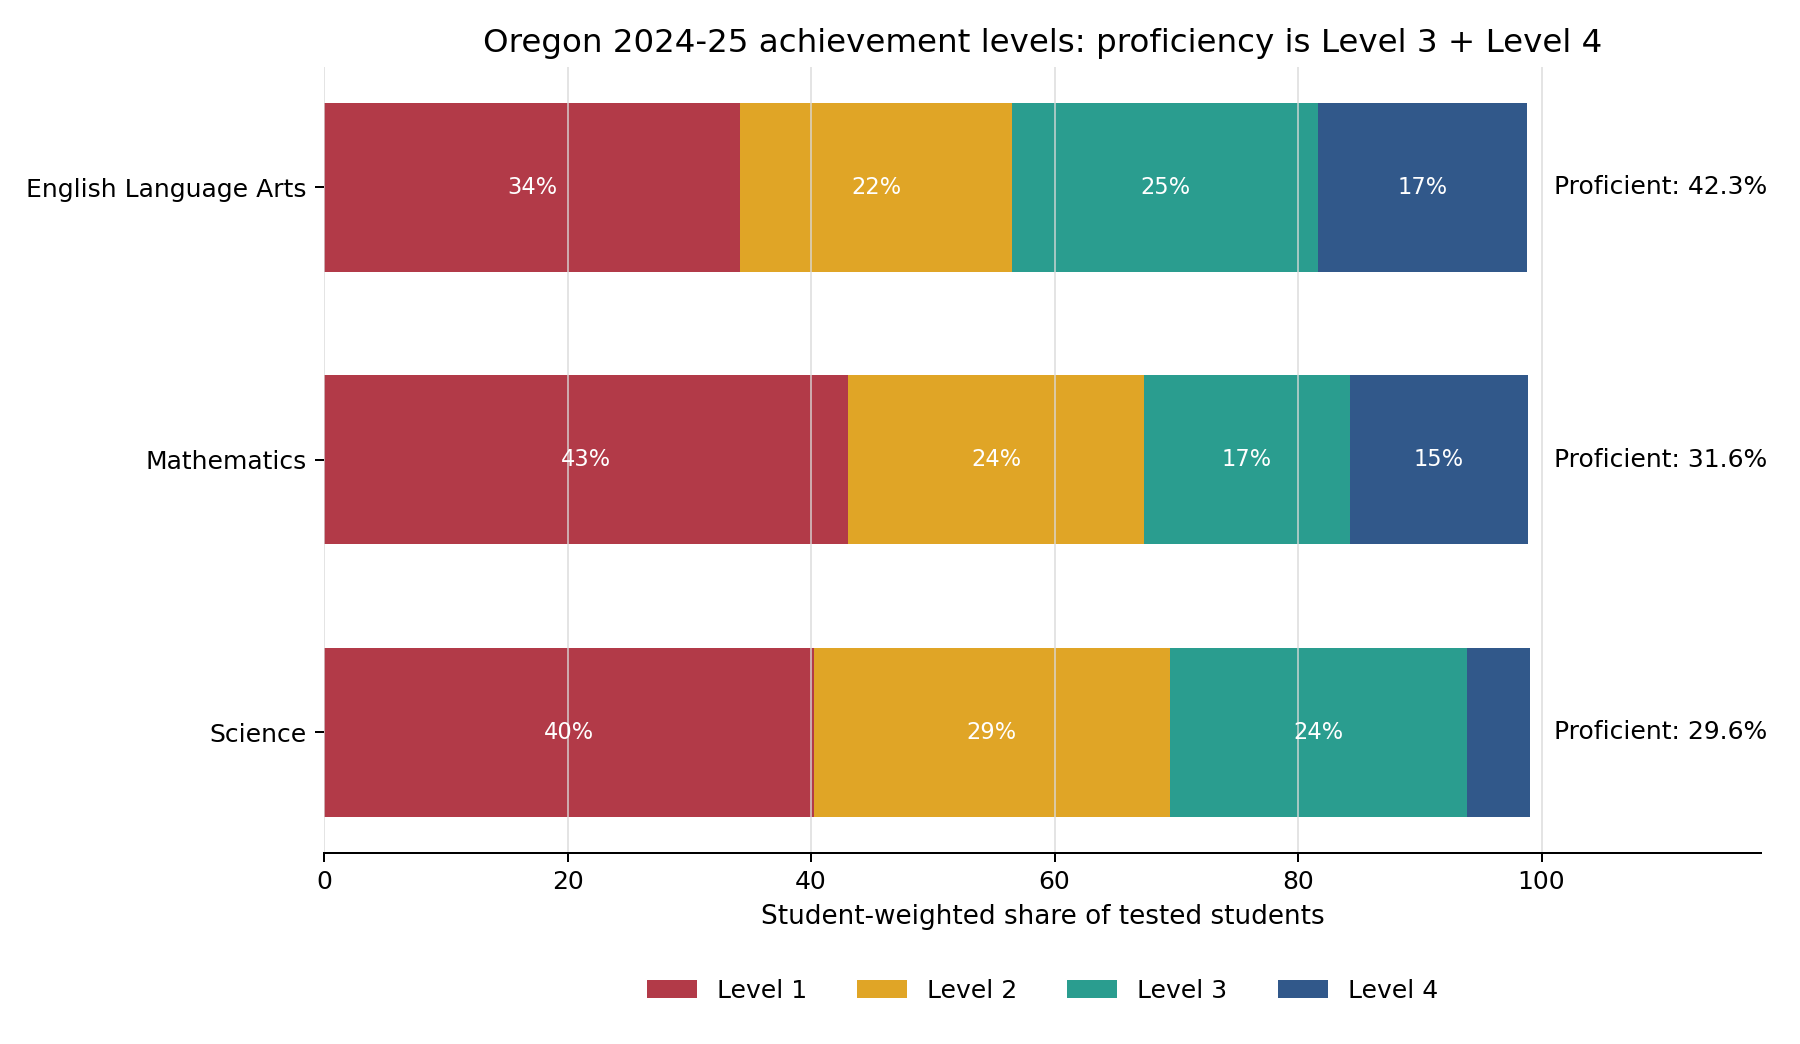
- Main outcome: Percent Proficient.
- Income companion spec: income, adult BA+ rate, attendance.
- Companion 2024-25 spec: poverty, adult BA+ rate, attendance (with optional income add-back).
- Exploratory predictors: overall spending per student, classroom spending per student, median class size.
Joint model results by subject
Elementary-primary income spec: Percent Proficient ~ income + adult BA+ + attendance
| Subject |
Beta income |
Beta education |
Beta attendance |
R^2 |
| English (ELA) |
0.065 |
0.455 |
0.438 |
0.684 |
| Math |
0.088 |
0.430 |
0.446 |
0.687 |
| Science |
0.110 |
0.487 |
0.290 |
0.571 |
These are standardized in-sample coefficients. The companion report separately gives repeated held-out R^2 and full coverage diagnostics.
Poverty-aware companion checks (2024-25)
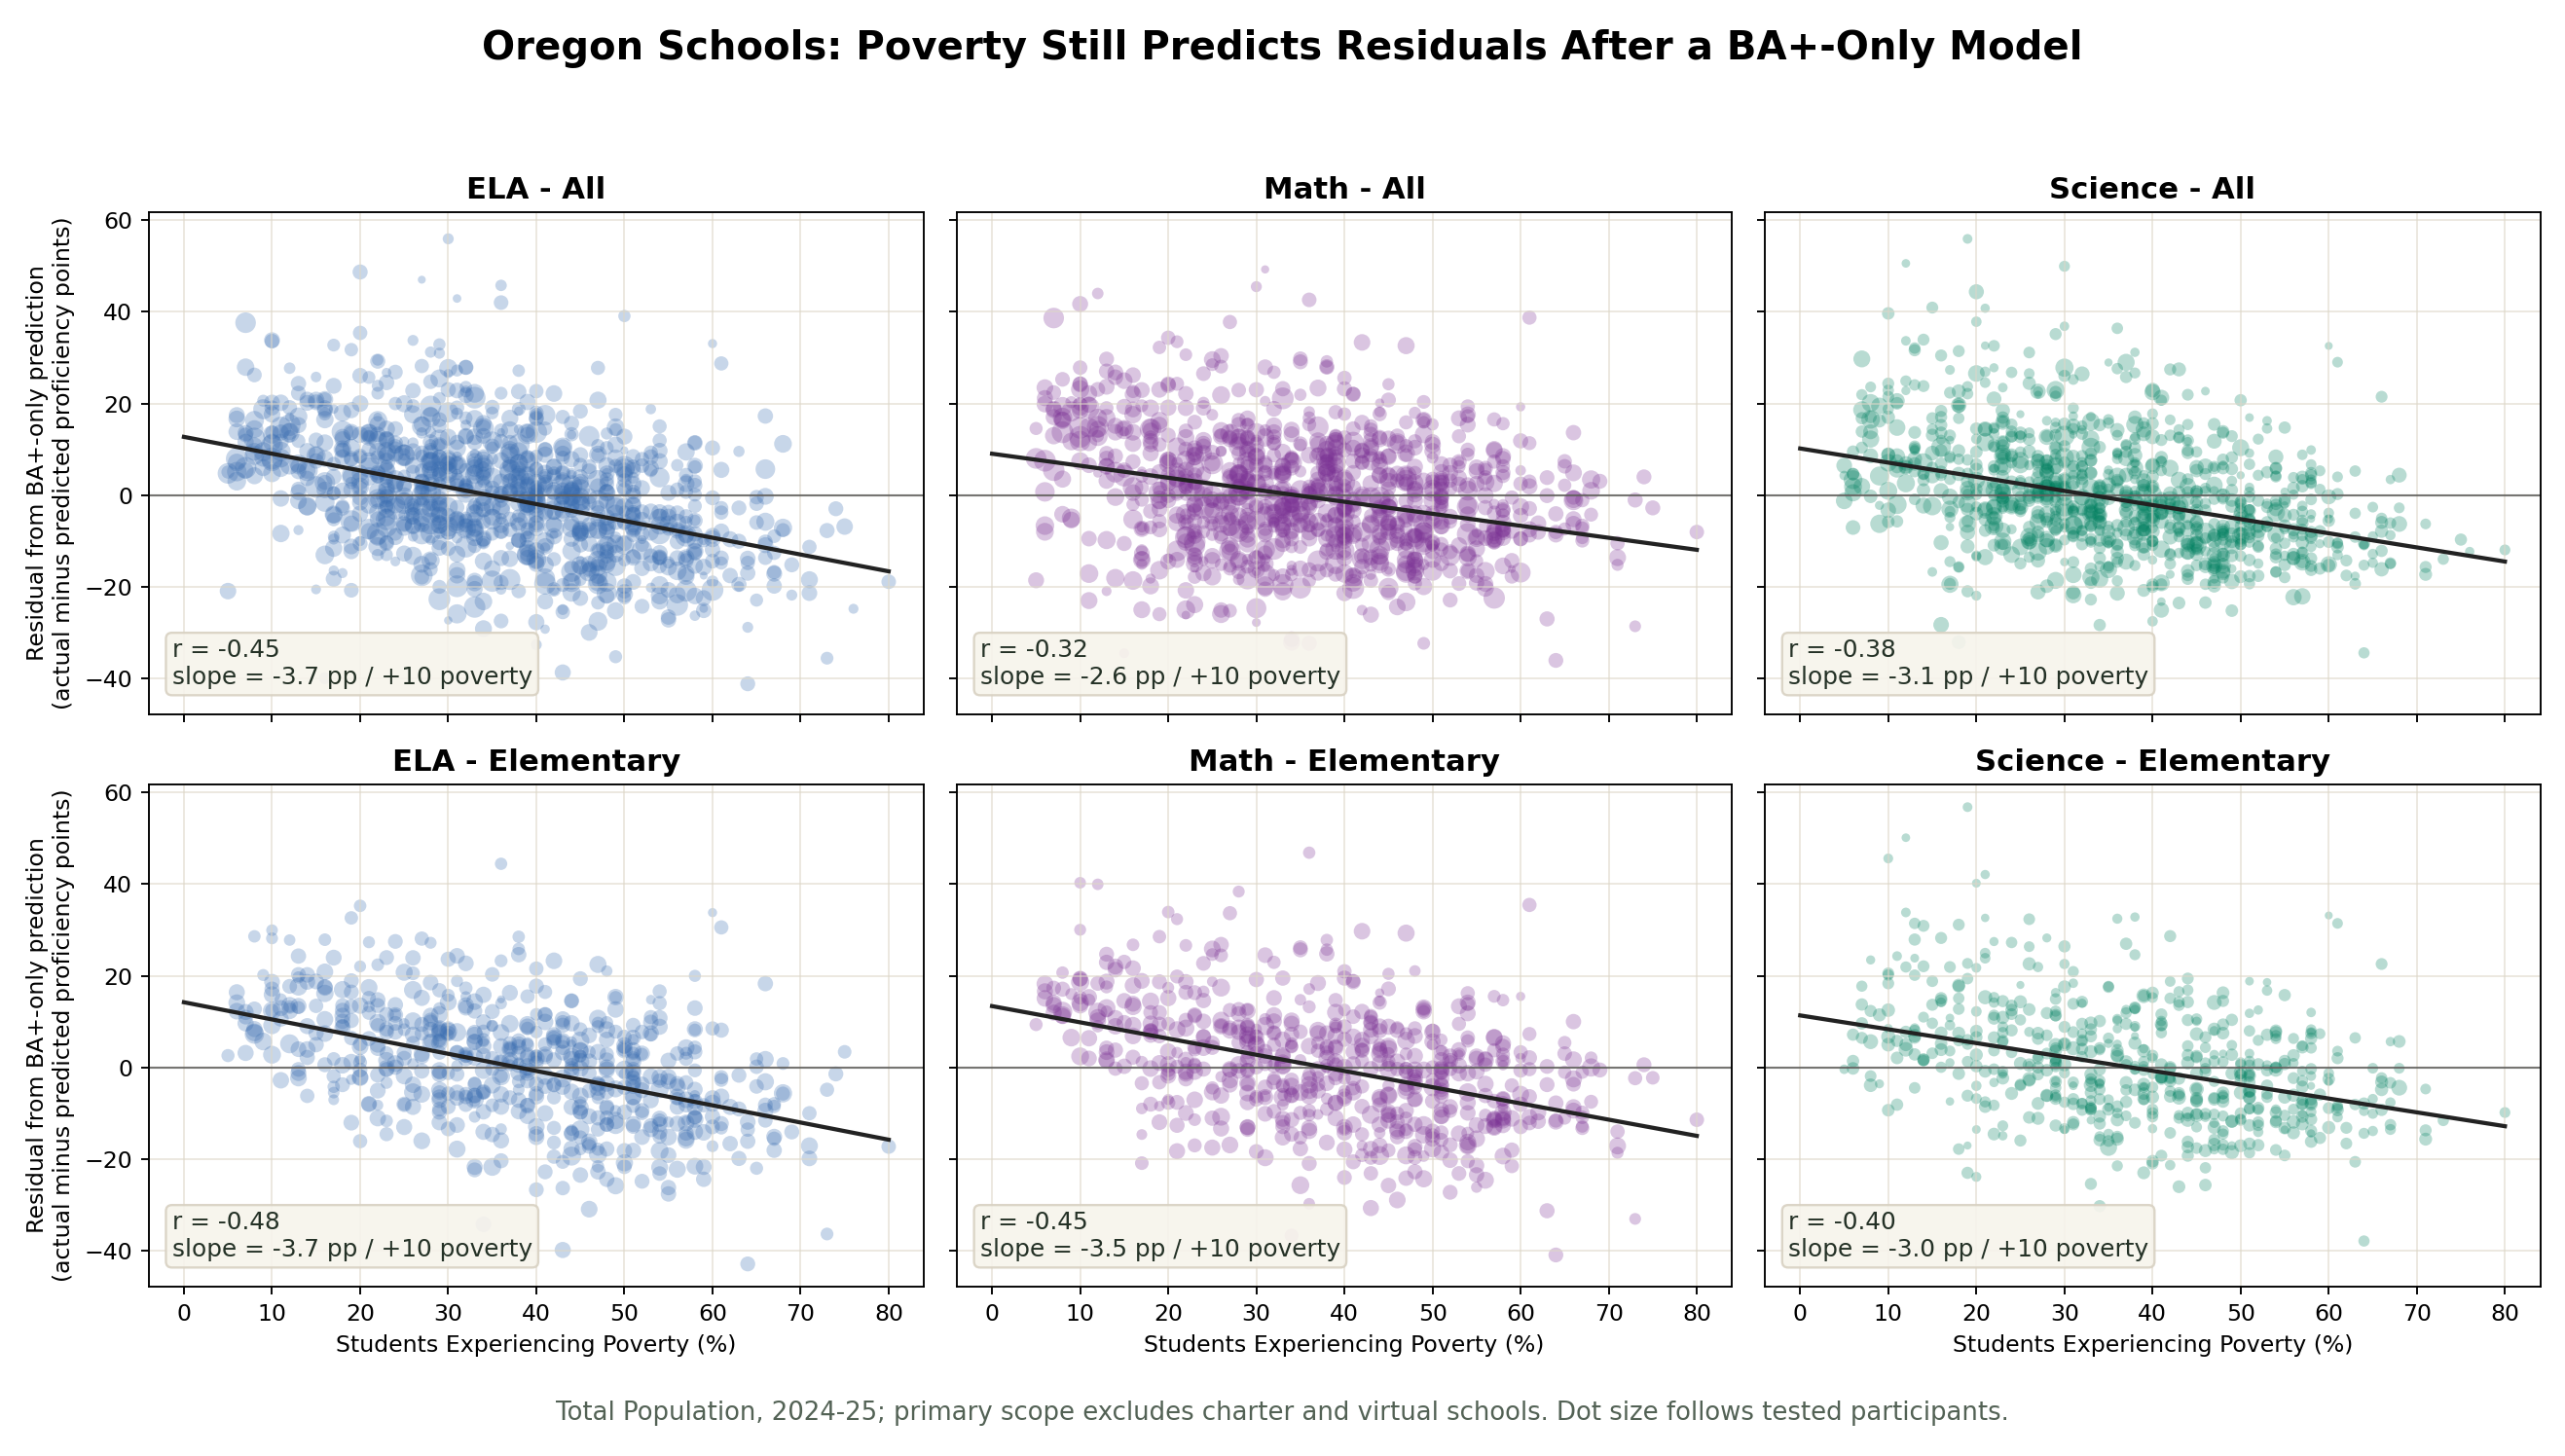
In ordinary-school cross-validated tests, replacing income with
Students Experiencing Poverty materially improved fit in all three subjects.
- ELA mean repeated-CV R^2: 0.6767 (income) vs 0.7676 (poverty); with both: 0.7727.
- Math mean repeated-CV R^2: 0.6788 (income) vs 0.7475 (poverty); with both: 0.7485.
- Science mean repeated-CV R^2: 0.5636 (income) vs 0.6538 (poverty); with both: 0.6546.
Interpretation: poverty predicts held-out school results better in these elementary-primary specifications, while income remains useful neighborhood description.
SEP interval endpoint and exact-only checks preserve the ordering.
Interaction effects
Paired held-out tests replace the old, mechanically optimistic in-sample interaction comparison.
The clearest gain appears in Math; the evidence is weaker or inconsistent in ELA and Science.
- ELA: mean held-out Delta R^2 = +0.005 (income model) and approximately 0.000 (poverty model).
- Math: mean held-out Delta R^2 = +0.016 (income model) and +0.012 (poverty model).
- Science: mean held-out Delta R^2 = approximately 0.000 (income model) and +0.004 (poverty model), with principal repeat ranges including zero.
Outcome-level heterogeneity
In the statewide Math Percent Level 4 income-and-adult-education model, the standardized adult-education
association was stronger than the income association (beta 0.534 versus 0.132; R^2 = 0.399).
Spending and class size
Spending variables are highly collinear with each other and with other SES measures. Ridge and permutation-based checks
showed model-sensitive contributions: usually secondary in pooled models, but more prominent in several fixed-effects specifications. Median class size remained near-zero after controls.
Robustness
- Repeated elementary half-sample checks preserve adult BA+ > income ordering.
- 2024-25 poverty-aware checks preserve a meaningful BA+ association while showing that school poverty is also a first-tier predictor.
- SEP midpoint, endpoint, and exact-only checks preserve the principal model ordering.
- Historical comparisons are deferred pending a separate historical-data audit.
Responsible interpretation
- These are association models, not causal estimates.
- School-level aggregation can hide within-school heterogeneity.
- School-site tracts may represent elementary catchments imperfectly and are weaker proxies for wider-drawing schools.
- Repeated-split ranges are descriptive stability checks, not confidence intervals.
- Non-core model families need their own audit before their older claims are treated as current.
Report and script index
Reports are grouped with the source files or machine-readable outputs that produced them.
The companion full-text exports are included where they are useful for auditing.
Overview and SES Baseline
Poverty-Aware Checks
Robustness, Outcomes, and Resources